

Summary
In this lesson, students will investigate the proportion of one of the colors of M&Ms in fun-sized bags and test a hypothesis regarding the claimed distribution of M&M colors using statistical methods. Students will collect data to test the distribution of one color of M&Ms by creating confidence intervals, testing hypotheses, and calculating p-values from binomial and normal distributions.
Essential Question(s)
How can we use the sample proportions of M&M colors in a bag to test the manufacturer’s claim?
Snapshot
Engage
Students compare the color distribution in a fun-sized bag of M&Ms to the company’s claim and calculate a p-value using the binomial distribution for the color they find most unusual.
Explore
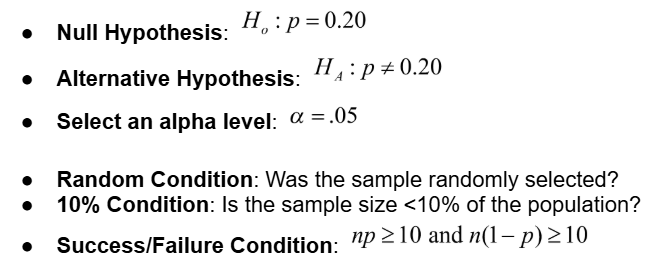
Students write hypotheses for the proportion of orange M&Ms, select a significance level, check test conditions, and determine if the sample size is sufficient for 1-proportion Z-test.
Explain
Students combine class data to create a larger sample, allowing them to use a normal approximation to conduct a 1-Proportion Z-test and interpret the results.
Extend
Students collect a second sample of data, combine trials, re-test the hypothesis, and construct a confidence interval for the true proportion of orange M&Ms.
Evaluate
Students graph cumulative relative frequency and margin of error versus sample size to determine if and when the sample proportion becomes statistically significant.
Materials
Lesson Slides (attached)
Color by Number handout (attached; one per student)
Visualize Cumulative Data (Teacher Guide) (attached)
Fun-size bags of candy-coated chocolate (e.g., M&Ms) (at least 3 fun-size bags per student)
Testing M&Ms Claim spreadsheet (see preparation note)
Calculators or statistical software (e.g., Desmos, TI-84, or Excel/Google Sheets)
Graphing tools (paper or digital)
Pens/pencils
Napkins, paper plates, or paper towels
Preparation
10 Minute(s)
Preparing for Data Analysis
Download the attached Testing M&Ms Claim spreadsheet and make it available to students by uploading to a class LMS or to Google Sheets.
Duplicate the “Class Data” tab on the spreadsheet so that there is one for each group in the class, and rename each tab to be unique to each group.
Within each tab, replace the letters under the “student” column with either the student's name or number. If numbers, make sure to assign a number to each student.
Add the link or QR code to slide 12 for students to have access.
In their tab, students will record the frequency of orange M&Ms and total M&Ms per fun-size bag in the table, and the spreadsheet will auto-populate a scatter plot, cumulative total, cumulative frequency, and p-value. Review the “Example” tab for a completed trial with data to see how the spreadsheet functions.
Data from the first trial will be used in the Engage through Explain sections. We will gather and analyze the data from subsequent trials in the Extend of the lesson. Feel free to adjust the number of trials your class collects to accommodate the time and the number of students in your class.
Engage
10 Minute(s)
Use the attached Lesson Slides to guide the lesson. Start by posing the essential question and explaining the objectives using slides 3–4.
Move to slide 5 and distribute a fun-size bag of M&Ms and a copy of the attached Color By Numbers handout to each student. Have students sort the M&Ms and record their sample distribution in the frequency table for question 1a on the handout.
Move to slide 6 and ask the students what seemed the most unusual about their sample (i.e., “Half my M&Ms were blue,” or “I didn’t have any blue M&Ms”). After a brief discussion, have students identify the sample proportion that seemed most unusual to them for question 1b and give them time to fill in their handout. Then, transition to slide 7 and reveal the actual claimed color distribution for chocolate M&Ms as it was in 2008, provided by the manufacturer:
24% blue
20% orange
16% green
14% yellow
13% red
13% brown
Ask students to write these distributions on their handout, using the provided lines under the corresponding colored M&Ms.
Then direct them to calculate the p-value based on the assumption that distribution provided by the manufacturer is true for question 1c.
Explore
25 Minute(s)
Explain that these proportions were once listed on the website but have since been removed. Let’s investigate if the population proportion is still 20% orange.
Explain to students that we don’t yet know how to test the distribution of all 6 colors at once so we are going to focus on the proportion of orange M&Ms. Have students get with a partner. As you work through slides 9–10, have students use the Elbow Partners strategy to develop answers to each prompt for question #2 of their handout.
Explain
30 Minute(s)
Using slide 12, have students navigate to the linked spreadsheet where they will record their sample data. First, ask students to input their data from the first bag of M&Ms as Trial 1.
Once all data is in the spreadsheet, move to slide 13 and have students return to their Color by Number handout. Instruct students to analyze the data by answering all of question #3 on their handout with their elbow partner.
Use slides 14–20 to lead a discussion on the statistical methods applied in the Explore phase concerning the following topics:
Hypothesis testing and p-values
Checking assumptions for normality
Confidence interval interpretation, 1-proportion Z-test, and margin of error
Hypothesis testing steps include setting up null and alternative hypotheses, calculating test statistics, and alpha levels
Using binomial model for small samples
Interpreting the p-value and making conclusions about the distribution of M&M colors
Extend
10 Minute(s)
Transition to slide 21. Give each student at least 1 fun-size bag of M&Ms and have them record the frequency of orange M&Ms and the sample size in the spreadsheet for trial 2. Use the class spreadsheet to track the cumulative relative frequency of orange M&Ms as the class sorts more M&Ms.
Once all data is in the spreadsheet, have students return to their Color by Number handout. Instruct students to analyze the data by answering question #4 on their handout with their elbow partner.
Use the attached Visualize Cumulative Data (Teacher Guide) handout to help students visualize how cumulative data narrows the margin of error and changes the p-value, potentially crossing the significance threshold.
Evaluate
15 Minute(s)
Transition to slide 22. Let’s look deeper into the scatterplot of cumulative relative frequency vs. sample size. In order to graph the margin of error we will need to input our trial into our calculator. Introduce students to the concepts of confidence intervals or show them how to use the classroom graphing technology to graph and calculate the margin of error.
Move to slide 23 and conclude with the Law of Large Numbers while students record their answers for question #5 of their handouts.
Resources
Bognar, M. (2025). Binomial distribution applet/calculator. Department of Statistics and Actuarial Science, University of Iowa. https://homepage.divms.uiowa.edu/~mbognar/applets/bin.html
K20 Center. (n.d.). Elbow partners. Strategies. https://learn.k20center.ou.edu/strategy/116
K20 Center. (n.d.). Elevator speech. Strategies. https://learn.k20center.ou.edu/strategy/57
Wicklin , R. (2017, February 20). The distribution of colors for plain M&M candies. The DO Loop. https://blogs.sas.com/content/iml/2017/02/20/proportion-of-colors-mandms.html