
Summary
During this fourth lesson in the Connecting Social Issues and Health Inequities unit, students view Oklahoma's life expectancy map, identify environmental threats that contribute to these life expectancies, and discuss what these threats mean with regard to air quality and society. Students then compare the Oklahoma City community with that of Washington D.C. before continuing to work on their project proposals.
Essential Question(s)
How do inequitable environmental factors affect human health?
Snapshot
Engage
Students view life expectancy maps of OK county.
Explore
Students use Google Maps to identify environmental threats within OK county.
Explain
Students discuss what the threats mean in regards to air quality and society.
Extend
Students compare and contrast OKC and Washington, D.C. communities.
Evaluate
Students expand initial proposals.
Materials
Lesson Slides—Comparing Communities (attached)
Proposal Rubric- Comparing Communities (attached)
S-I-T (Surprising, Interesting, Troubling)—Comparing Communities (attached; optional; one per student)
Paired H-Chart—Comparing Communities (attached; one per student)
Life Expectancy Comparison Chart—Comparing Communities (attached; one per student)
3x5 index cards (optional; one per student)
Computers or individual devices
Access to internet or wifi
Engage
Begin the lesson by showing the unit’s essential question on slide 3 of the attached Lesson Slides.
Display slide 4. Share the lesson’s learning objectives.
Display slide 5. Instruct students to visit the OK2Share website and view the life expectancy map of Oklahoma county as a group.
Ensure that students look at data from Oklahoma county by changing the county at the bottom right of the map. Have students hover their cursors over the county and the zip code. The average life expectancy will change as the cursor moves over the different zip codes. As students locate county and zip code, have them record their initial observations.
Display slide 6. Pass out the S-I-T (Surprising, Interesting, Troubling) handout (or a 3x5 index card) to each student.
Share the instructional strategy S-I-T (Surprising, Interesting, Troubling).
Instruct students to record one surprising fact or idea, one interesting fact or idea, and one troubling fact or idea.
Encourage students to share their thoughts in small groups or with a partner.
Display slide 7. Discuss the following questions as a whole group:
What do these data tell us?
How could you determine average life expectancy by zip code?
How does everything that we have learned to this point connect?
Explore
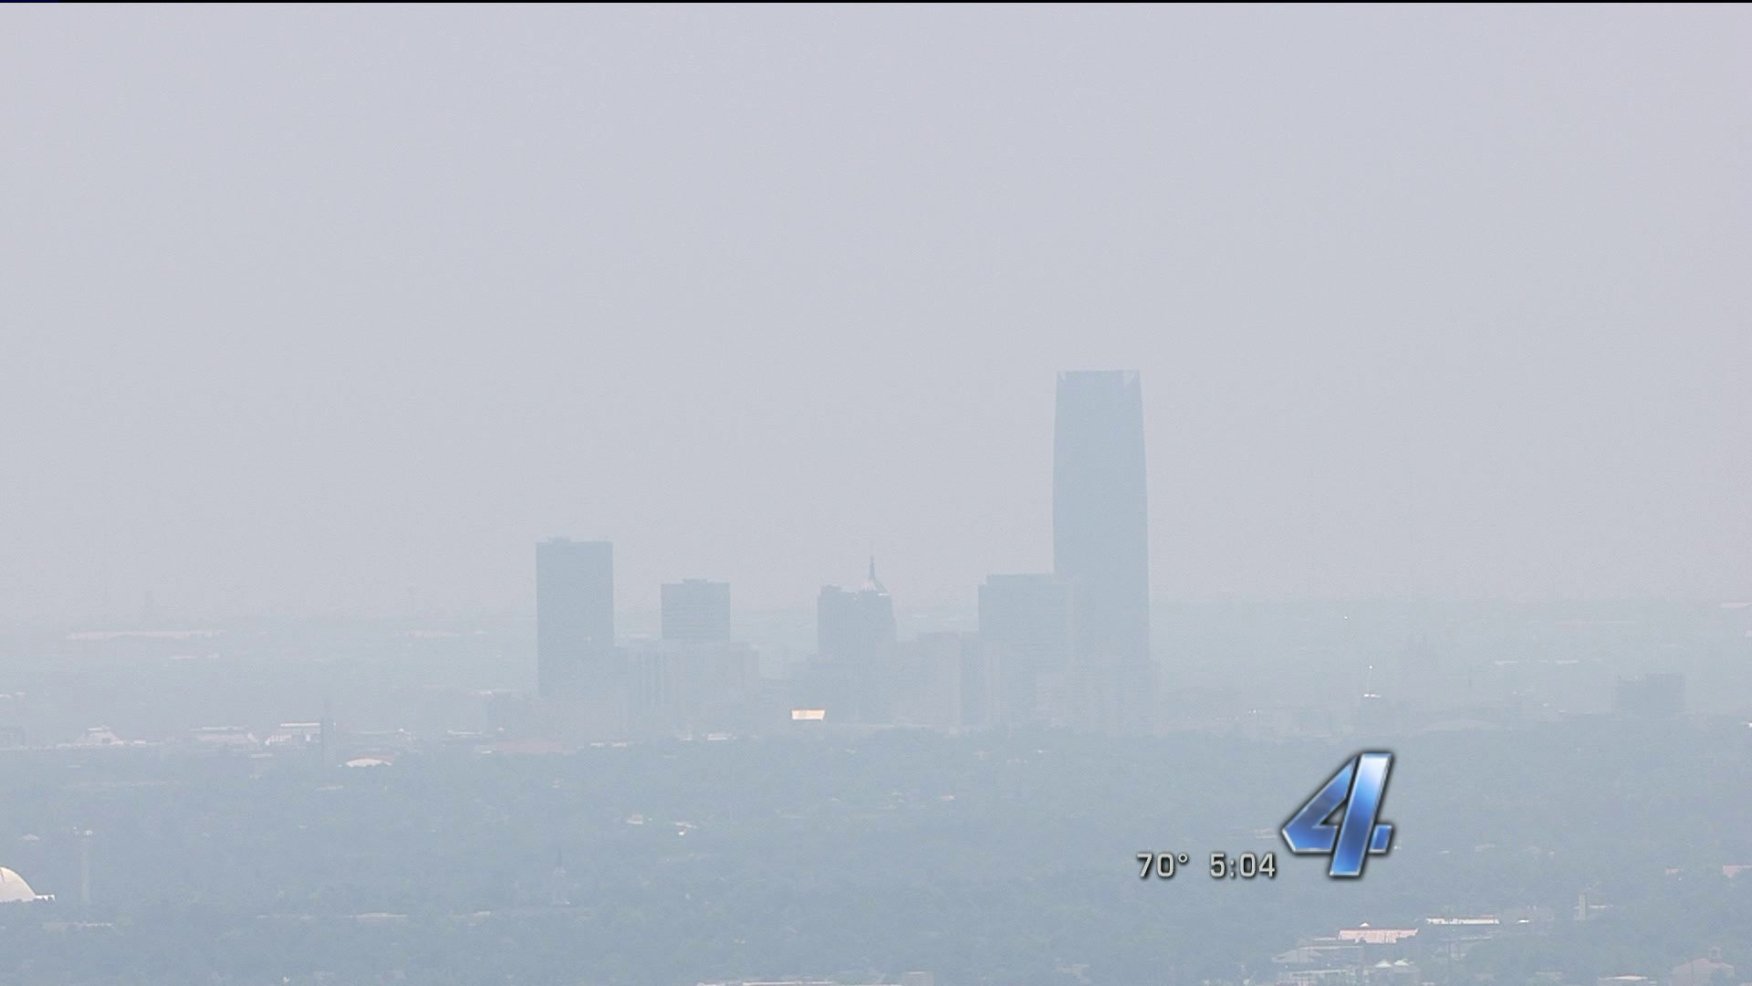
Display slide 8. Instruct students to pull out their handout Zip Code Breakdown from the previous lesson. While viewing the two aerial photos have students look for environmental threats found in each zip code. Some examples of environmental threats are listed below:
Landfills
Refinery
Fleet Parking Lot
Major Highway
Access to grocery stores
Ask students also to determine the average home values for the two locations. They can use apps such as Zillow to help them find the home values.
Display slide 9. Ask students to analyze the property values reflected in the chart for the two zip codes. Encourage them to research access to such commodities as fresh produce and grocery stores as well.
Explain
As a whole group, facilitate a discussion to enable students to share the connections they are making. Display slide 10 and use the following prompts in this discussion:
How do these environmental threats affect air quality?
How are we able to determine life expectancy by zip code?
What does all of this mean?
Extend
Display slide 11. Pass out the attached Paired Texts—H-Chart handout and share the instructional strategy Paired Texts H-Chart. Have students compare and contrast OKC and Washington D.C. Now that students have a better understanding of the science behind asthma, they can focus on the social aspects. Ask them to write details about Washington, D.C. in the left-hand column and details about Oklahoma City in the right-hand column.
Ask them to write down any additional similarities or differences they notice in the video distinguishing OKC from Washington D.C.
Display slide 12. Share the entire video that students watch in Lesson 1.
Display slide 13. After the video, instruct the students to share what they wrote with an Elbow Partner and add any new information they discovered through sharing. Ask students to discuss as a whole group the connections they have made. At this point, students should begin to see a correlation between race, poverty, and health.
Display slide 14. Ask students if they have discovered answers to questions on the Driving Question Board. Encourage them to add new questions that they do not, as yet, have answers to.
Evaluate
Display slide 15. Instruct students to continue to work on their final proposals for the storyline, picking up where they left off in Lesson 3, adding more information and expanding upon their initial responses.
What is the problem?
What do you know about the problem that other people should know?
What evidence can you provide to support your claim?
What are some possible solutions to this problem?
Resources
Children's National Medical Center. (2013). Health Disparities, Focus on Asthma. [Video]. YouTube. https://www.youtube.com/watch?v=fMufgnJId58
Environmental Protection Agency. (n.d.). Superfund sites. https://www.epa.gov/ok/cleanups-oklahoma#sites
Environmental Protection Agency. (2020). Cleanups in Oklahoma. https://www.epa.gov/ok/cleanups-oklahoma
Google maps satellite. (n.d.). Oklahoma City, OK. [Aerial maps]. https://earth.google.com/web/@35.48264792,-97.4791978,363.52415431a,121151.59788577d,35y,0h,0t,0r
K20 Center. (2021). Driving Question Board. Strategies. https://learn.k20center.ou.edu/strategy/1511?rev=8567
K20 Center. (n.d.). Elbow Partners. Strategies. https://learn.k20center.ou.edu/strategy/116
K20 Center. (2020). Paired Texts H-Chart. Strategies. https://learn.k20center.ou.edu/strategy/132
K20 Center. (2020). S-I-T (Surprising, Interesting, Troubling). Strategies. https://learn.k20center.ou.edu/strategy/926
Oklahoma State Department of Health . (2018). 2018 Life Expectancy at Birth by Zip Code. OK2SHARE. https://www.health.state.ok.us/ok2share/index.shtml
Zillow. (n.d.). United State Home Values. [Chart]. https://www.zillow.com/home-values/