

Summary
This multiple-day collaborative group lesson uses dice to explore the probability of simple events similar to those in the book "Jumanji" by Chris Van Allsburg. Students will examine sample space, theoretical probability, and experimental probability and make predictions using outcomes of probability. (NOTE: Allow approximately two to three days to complete all activities and discussions. Estimated times are provided below in the lesson snapshot. These amounts may vary depending upon how much time is needed for class discussion, reflection, each activity, and the length of each class period.)
Essential Question(s)
When might we use probability and why? Why do we need probability?
Snapshot
Engage
Students read the book Jumanji to engage and activate prior knowledge regarding likelihood of an simple event.
Explore
Students experiment with a partner to explore the probability of sums when rolling dice.
Explain
Students discuss and explain the connections and differences between sample space, theoretical probability, and experimental probability.
Extend
Students explore other games and activities recording sample space and theoretical probability for a game of students' choice. Engage in "game stations" that explore the experimental probability associated with games.
Evaluate
Students reflect through writing with a focus on learning sample space, theoretical probability, experimental probability and making predictions based on these concepts.
Materials
Lesson Slides (attached)
Jumanji by Chris Van Allsburg
Dice (two per group)
Sums of Jumanji Recording Sheet (attached; printed front and back; one or two per student)
Game Stations Probability Data Sheet (attached; one per student)
Board games or other probability-based activities
Paper
Pencils
Engage
20 Minute(s)
Introduce the lesson using the attached Lesson Slides. Display slide 2 to share the title of the lesson. Go to slide 3 to display the lesson's essential questions: When might we use probability and why? Why do we need probability? Go to slide 4 to share the lesson's learning objective with students. Review this with your class to the extent you feel necessary.
Go to slide 5. Ask the following question:
Have you read the book or seen one of the Jumanji movies?
If you have students who have read the book or seen the movies, ask one or two of them to provide a brief description of the story.
Option 1: Reading the Book
Go to slide 7. Read the book to the class, stopping on page 22 after Judy is told by Peter "If you roll a 12, you can get out of the jungle."
Display slide 8. Instruct students to find a partner and use the Think-Pair-Share strategy to reflect on the question, "What is the likelihood that Judy will roll a 12 to end the game?"
Think: Students will individually reflect using the spectrum of likelihood (impossible, 0; unlikely, between 0 and 1/2; likely as not, 1/2; likely, between 1/2 and 1; or certain, 1). Pair: Instruct students to turn to their partner and take turns sharing and explaining their responses. Share: Student pairs should then share with the whole class what they discussed (what they agreed or disagreed upon and why).
Display slide 9 and finish reading the book.
Display slide 10 and return to the question about Judy and the game, but this time have students consider "Which sum or sums would Judy most likely have rolled with two standard dice?" Have students participate in another Think-Pair-Share.
Option 2: Watching the Movie Clips
Display slide 11 and play the first 39 seconds of the video clip Jumanji 7/8, stopping the video right before Sarah rolls the dice.
Display slide 12 and instruct students to find a partner and use the Think-Pair-Share strategy to reflect on the question: "What is the likelihood Sarah will roll a 7 to end the game?"
Think: Students will individually reflect using the spectrum of likelihood (impossible, 0; unlikely, between 0 and 1/2; likely as not, 1/2; likely, between 1/2 and 1; or certain, 1). Pair: Instruct students to turn to their partner and take turns sharing and explaining their responses. Share: Student pairs should then share with the whole class what they discussed (what they agreed or disagreed upon and why).
Once the whole class discussion has finished, display slide 13 and finish watching Jumanji (7/8), then move to slide 14 to show Jumanji (8/8).
Display slide 15 and ask the following questions:
"What was the likelihood that Alan was going to roll a number that was three or greater?"
“Was the likelihood greater for Sarah or Alan to finish the game? Why?".
“Which sums were Sarah and Alan most likely to roll with two standard dice?"
Have students participate in another Think-Pair-Share.
Both options pick back up here:
Go to slide 16. As a whole group discuss the question: "What sums are impossible to roll with two standard dice?" Allow students time to consider a few sums that would be impossible to create when rolling two standard dice. Students will hopefully come to a consensus that the sums can only be 2-12. Nothing less and nothing more would be possible unless they were to use dice with more sides or different values.
Go to slide 17. Ask students to define Sample Space. Call on a few students to answer then briefly conclude that the range of possible outcomes is called the Sample Space. In the story, Sample Space the possible sums.
Explore
15 Minute(s)
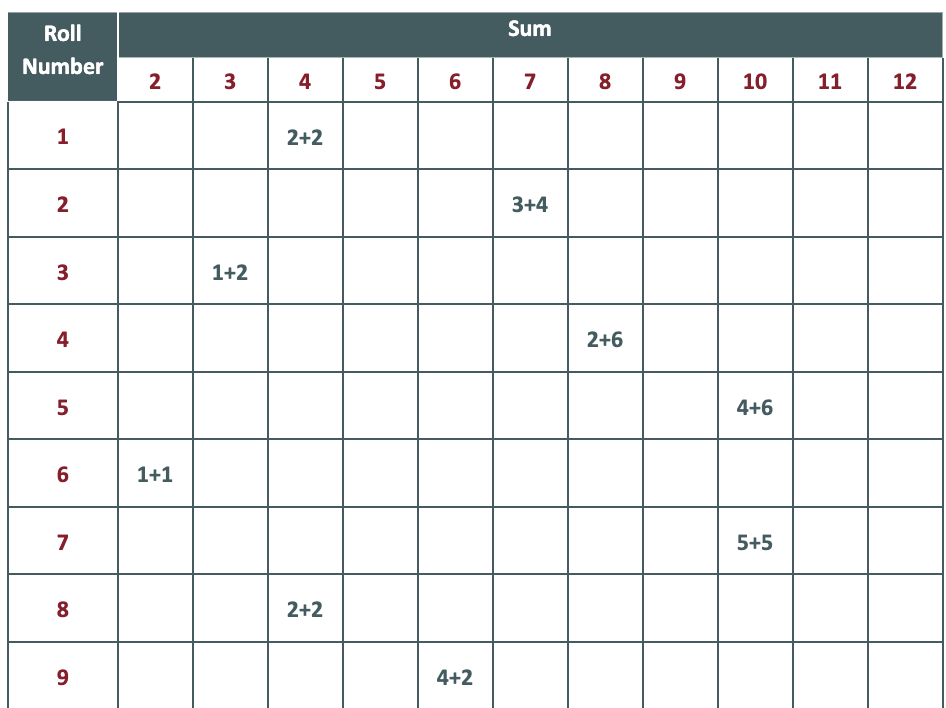
Display slide 18. Students move into collaborative pairs. For the experimental probability activity, students need two dice and one Sums of Jumanji Recording Sheet. Student pairs predict and record what sum would be rolled the most often on the top of their page. These predictions and justifications can be shared aloud after being recorded. Student pair will then complete the experimental probability activity using the instructions on slide 19. Go over the directions on the slides. Tell students they will roll both dice 15 times and record each time a sum appears. Emphasize that after each roll, students should record the value of the sum under the corresponding column. (See the image below for an example.)
Go to slide 20. After student pairs have completed their rolls and recorded all data, instruct pairs to flip to the back of their handout and begin making predictions based on their data considering the scenarios below.
"What might happen to the results if we continued to roll the dice another 10 times, 15 times, 100 times, etc.? What would you expect to happen to the sums?"
"If we rolled the dice ____ more times, how many times would you expect to get a sum that equals ____?"
"If we had rolled the dice only ____ times, how many times would you expect to have received a sum that equals ____?"
Student pairs should use proportional reasoning (or knowledge to make equivalent fractions or ratios) to discuss and answer these questions. Each group will receive different answers based on their experimental data. Also, for the groups who cannot solve for a whole number, discuss the implications and meaning of "part of whole" for these instances. For example, ask, "Can you roll the sum ‘6' 13.2 times? Is that a good representation? Why or why not?"
Each group will have different quantities for each sum because each experiment will vary slightly in outcomes. These differences can be explored later during the Explain portion of the lesson.
Explain
15 Minute(s)
After student pairs make their claims based on the scenarios from slide 20, display slide 21 and ask open-ended questions to facilitate a class discussion. Allow students to reflect on their results before asking them to share aloud. This reflection time provides an opportunity for all to consider and formulate a response in order to contribute to the group discussion.
These are possible open-ended questions to help facilitate class discussion. Answers should come from the student pairs' experience based on the previous activity.
What do you notice about your experimental probability results?
Which sums appeared most often during the experiment? Least often? Why do you think that occurred? Why do you think each group got different/similar answers?
What might happen to the results if we continued to roll the dice another 10 times, 15 times, 100 times, etc.? If we rolled it ____ many more times, how many times would you expect to get a sum that equals ____? (Students should use proportional reasoning to answer these questions, but, again, each group will have different answers based on the experimental data. Also, for the groups that don't receive a whole number, discuss the implication and meaning of part of a whole in these instances. For example, "Can you roll a sum 13.2 times?")
Think about the sample space of the sums created when using the two dice. What sums might you (theoretically) expect to see most/least often when considering the possible sums created between the dice? How is theoretical probability different from experimental probability? (You might have to lead with questions like “What is the sample space of the sums?” and “What is the theoretical probability of each sum?” if students don't reach the connection on their own from the previous question.)
Considering the theoretical probability, how many times would you expect to roll a sum of ____ during 15 rolls?
Discuss the difference between sample space, theoretical probability, and experimental probability. (This is a great opportunity to refine students' thinking and connect back to academic vocabulary.)
Allow discussion for multiple students to share out about their experiences and findings.
Extend
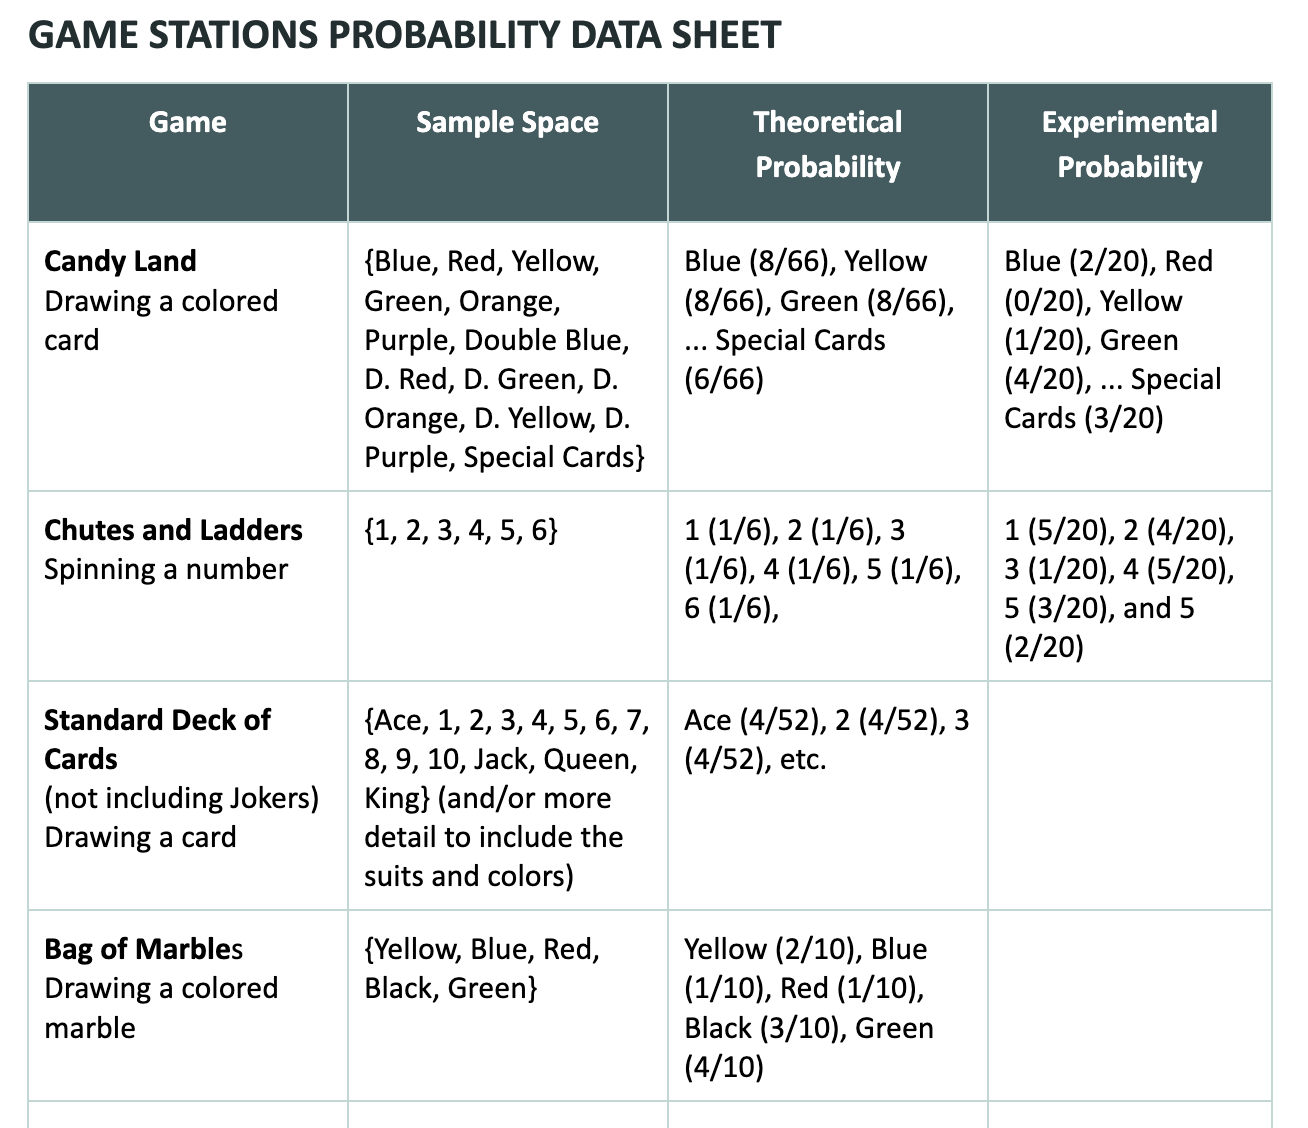
Following the discussion, display slide 22 and instruct students to think about other games or activities that they have at home that might have a sample space, theoretical probability, and experimental probability. Hand out the Game Station Probability Data Sheet to each student. As a whole group, brainstorm and list games or activities on the board while students record them on their handout.
Display slide 23 and introduce the student’s homework. Students find sample space and theoretical probability using a game or activity that they have access to at home. (Optional: Ask students to bring the game or activity that they used for homework to school the next day so that their data for sample space and theoretical probability directly connect to the experimental data that they will record from the game stations).
Day 2
In class the next day, go to slide 24 and set up game stations around the classroom. Students will work in groups recording the experimental probability of the games that they choose to play.
Using the hangout Game Station Probability Data Sheet from the night before, students record their experimental probability findings for each game they play. See the example below for what it might look like.
Evaluate
Display slide 25. After all findings have been recorded, each student should individually reflect through a detailed writing using the strategy What Did I Learn Today. Writing should specifically focus on the connections (similarities and differences) between the experimental findings compared to the sample space and theoretical probability for each game listed or just the games they played in class. Students should also create and record examples of possible predictions based on the data from the experimental probability and the theoretical probability for each game (or just the games that they played in class).
Resources
Davis. B. (n.d.). Teaching mathematics through literature. LEARN North Carolina. http://web.archive.org/web/20180131132522/http://www.learnnc.org/lp/pages/3326?ref=search
K20 Center. (n.d.). Google Docs. Tech Tool. https://learn.k20center.ou.edu/tech-tool/2327
K20 Center. (n.d.). Google Slides. Tech Tool.
K20 Center. (n.d.). Think-pair-share. Strategies. https://learn.k20center.ou.edu/strategy/139
K20 Center. (n.d.). What did I learn today. Strategies. https://learn.k20center.ou.edu/strategy/169
Van Allsburg, C. (2011). Jumanji. Houghton Mifflin Harcourt.
YouTube. (n.d.-b). Jumanji (7/8) Movie Clip - earthquake.
YouTube. (n.d.-c). Jumanji (8/8) Movie Clip - Jumanji.
YouTube. https://www.youtube.com/watch?v=M0TjT53qpFY