Card

WIS-WIM
This strategy helps students interpret graphs, tables, and figures.
WIS-WIM
Summary
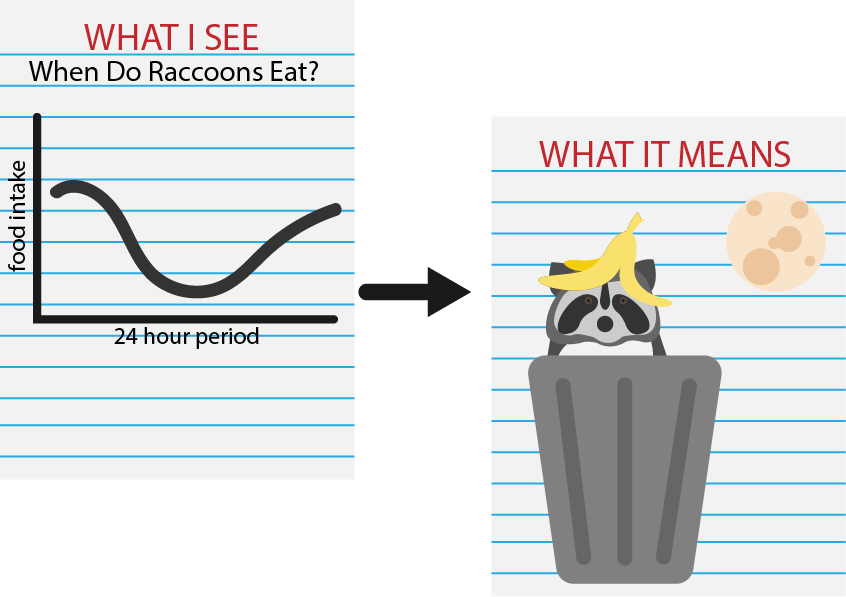
WIS-WIM helps students learn how to read and summarize graphs, tables, and figures. The first part, "What I See," challenges students to break down a graph into individual observations. The second part, "What It Means," guides students to create meaning from those observations and then fuse those meanings to produce a logical explanation of what the graph depicts. This strategy enables students to take given data, build a visual in their minds, and translate the visual into words. Students may complete this activity independently or in groups of 3–4.
Procedure
Students receive a graph, table, or figure to interpret.
Identify (“What I See”): Students identify what they see regarding changes, trends, or differences depicted in the graph.
Students draw arrows and write a “What I See” comment for each arrow. Instruct students to be concise with their comments and focus on only what they observe. (They should not try to explain the meaning at this point.)
Interpret (“What It Means”): Students interpret the meaning of each “What I See” comment by writing a “What It Means” comment next to it. (They should not try to interpret the whole graph yet.)
Students write a caption in paragraph format. Have them start with a topic sentence that describes what the graph shows. Next, have them join each “What I See” comment with its corresponding “What It Means” comment to make a WIS-WIM sentence. Students should build a coherent paragraph out of their WIS-WIM sentences.
Biological Sciences Curriculum Study. (2012). I Can Use the Identify and Interpret (I2) Strategy [Student edition]. https://media.bscs.org/icans/Icans_I2_SE.pdf Biological Sciences Curriculum Study. (2012). I Can Use the Identify and Interpret (I2) Strategy [Teacher edition]. https://media.bscs.org/icans/Icans_I2_TE.pdf


