Card

Human Scatter Graph
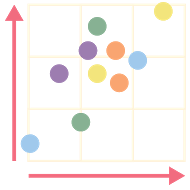
Students use the classroom as an x- and y-axis and their bodies as points in a scatter plot in this instructional strategy, offering the teacher a quick visual representation of student answers and their confidence.
Human Scatter Graph
Summary
Students create a scatter plot of their answers to a question and how confident they are in those answers, providing a visual of the class's responses.
Procedure
Designate two perpendicular walls in your classroom to be the x-axis and the y-axis.
The y-axis should be labeled with sections called A, B, C, and D. These will be choices for the students later on in the activity, so leave enough room for multiple students to stand in the same area.
Label the side of the x-axis that is closest to the y-axis "low confidence" and the side that's farthest away from the y-axis "high confidence." This continuum will be used in the activity as well.
Provide students with a multiple choice prompt.
Allow students time to reflect on the prompt and select a response.
Have students move to the location in the classroom that best matches their response relative to the x- and y-axes. For example, a student who thinks that the answer is C would stand even with C on the y-axis and in the middle of the x-axis, denoting moderate confidence in the answer.
Observe the dispersion and use it to inform the next part of instruction.
Discuss with the class what the dispersion might mean in regards to the prompt they were given.
Keeley, P., & Tobey, C. (2011). #22. Human scatter graph. In Mathematics Formative Assessment: 75 Practical Strategies for Linking Assessment, Instruction, and Learning (pp. 104-107). Thousand Oaks, CA: Corwin, SAGE.

