
Summary
During this second lesson in the Connecting Social Issues and Health Inequities unit, students analyze Oklahoma City's Air Quality and pollutant levels from 2020 and summarize important information about air pollutants in a public service announcement.
Essential Question(s)
How do inequitable environmental factors affect human health?
Snapshot
Engage
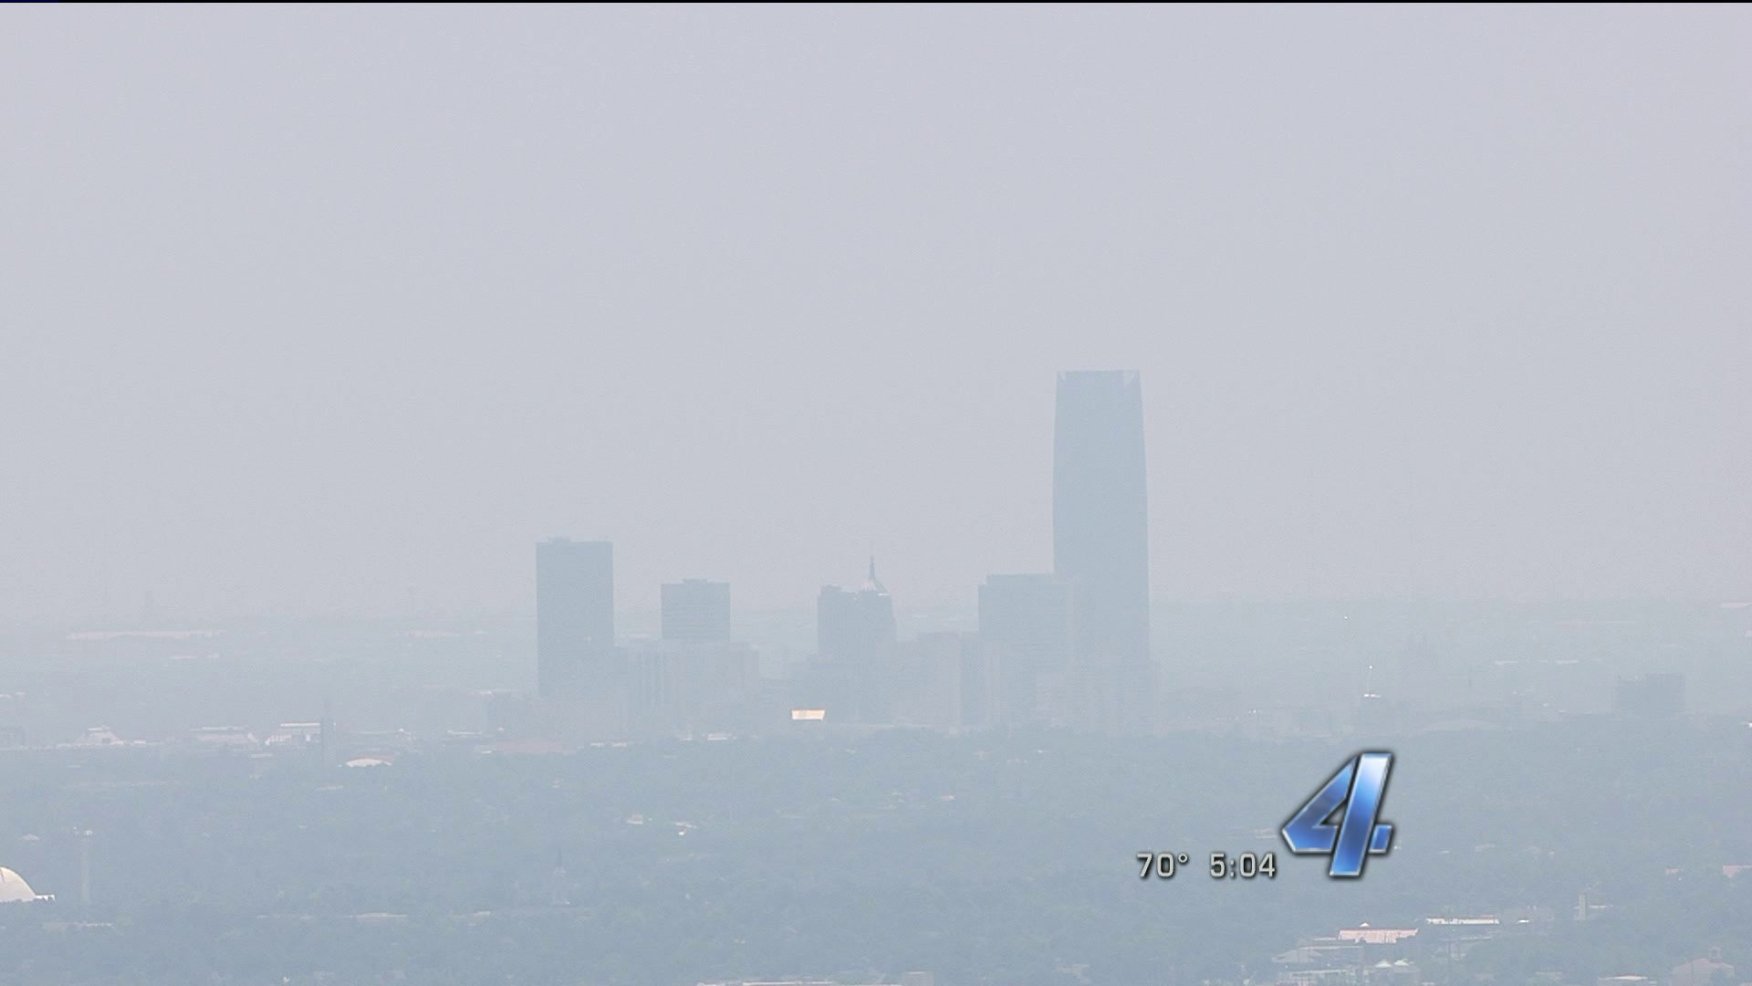
Students view an image of a hazy, ozone alert day in Oklahoma City and discuss what they know about an ozone alert.
Explore
In groups, students evaluate data collected in 2020.
Explain
Students create anchor charts to summarize their data.
Extend
Students compare Oklahoma City air quality data from 2017 to 2020.
Evaluate
Students create public awareness content (book/podcast/song/video) at the level of a child about one air pollutant they learned about.
Materials
Lesson Slides- Environmental Factors (attached)
Carbon Monoxide- Environmental Factors (attached; one per group)
Lead in Air- Environmental Factors (attached; one per group)
Nitrogen Dioxide- Environmental Factors (attached; one per group)
Ozone- Environmental Factors (attached; one per group)
Particulate Matter- Environmental Factors (attached; one per group)
Sulfur Dioxide- Environmental Factors (attached; one per group)
Public Service Announcement Rubric- Environmental Factors (attached; one per student)
One device with internet connection per student if possible
Engage
Begin the lesson with slide 3 of the attached Lesson Slides. Project the image of hazy summer day in Oklahoma City.
Ask students the following questions:
Have they ever heart of an ozone alert day?
What does “ozone alert” mean?
How can citizens protect themselves when an ozone alert has been made?
Encourage students to share any prior, relevant experience that might be beneficial throughout the lesson. Record student responses on the board to use in later whole group discussions.
Display slides 4 and 5 to review the lesson’s essential question and learning objectives.
Explore
Divide students into groups of 3-5 to evaluate real data collected in 2020. Assign them a specific time period.
Display slide 6. Share the sample data from January through February 2019.
Walk students through the steps to copy and paste their data into a spreadsheet.
Display slide 7. Share the sample graph generated from the data on slide 6. Walk students through the steps to create a graph with their data.
Display slide 8. Instruct students to go to the Oklahoma Department of Environmental Quality (DEQ) website and pull the data for their time period (Oklahoma City two month- period in 2020). Using the OK-DEQ website, have them create line graphs.
Each group will create a graph for each pollutant by day.
Each person in the group will create at least one graph and research the corresponding pollutant.
For example, Group 1 analyzes data from January through the end of February to create six graphs (CO, Ozone, NO2, SO1, PM2.5, and PM 10). They will use a graphing tool in Google Sheets or Excel. Graphing this information will help students identify patterns in the data.
Group assignments for graphing exercise:
Group 1: January & February
Group 2: March & April
Group 3: May & June
Group 4: July & August
Group 5: September & October
Group 6: November & December
Display slide 9. Instruct students to remain in their groups. Pass out one copy of each of the following handouts to each group:
Share the instructional strategy, Jigsaw, with students and instruct them to read one of the informational pages and become well enough acquainted with the content to be considered “expert.” While the “experts” are reading their pages, they should record questions and observations that they will share with their group.
Once all of your students have completed the reading, display slide 10. Instruct students to assemble as groups made up of classmates who read about the same pollutant. Ask them to share the questions and observations they wrote along the side of their paper with the new group. As their partners are sharing out, they should include any additional observations or questions they didn’t originally write down.
After students share their questions and observations, display slide 11 and instruct your students to go back to their original group and an “expert” will share what they learned from each of the informational pages.
Display slide 12. Ask students to capture questions and relevant information for the class Driving Question Board. Either pass out the Driving Question Board handout, or have students write their questions on a white board or chart.
As a group, students should be able to respond to the following questions about each of the pollutants (slides 13-17):
What do we know?
What does this information mean?
What information do we still need?
Explain
Display slide 19. Ask students to assemble in their original groups. Instruct students to create an Anchor Chart that includes the following:
Analysis of their designated time period.
Knowledge of how pollutants interact with one another.
Knowledge of how pollutants affect humans.
Group answers to the following questions:
What do we know?
What does this information mean?
What information do we still need?
Advise students to create a visually strong Anchor Chart that includes a mixture of words, pictures, and diagrams. Since each group examined two-month periods, ask students to look at the entire year.
Ask them to look for trends in ozone levels. Once the groups have finished their Anchor Charts, have them post them around the room.
Display slide 20. Have students do a Gallery Walk and record observations and questions they still have.
Extend
Once students have a clear understanding of the types of air pollution, the effects, and how they are measured, display slide 21.
Ask students to compare 2020 data to the 2017 data reflected on this slide.
Create a class Google Slides document and have students copy their graphs onto the common document.
Display slide 22. share the accumulated data with your students, and discuss the following prompts:
What does this information mean?
What information do we still need?
What differences did you notice between 2020 & 2017?
What similarities did you notice between 2020 & 2017?
Why would these differences occur? Why do you think this?
Display slide 23. This is a good time for you to refer to the Driving Question Board and ask students if they have answered any questions that were originally added to the board. Additionally, ask if there are new questions that should be added to the Driving Question Board.
Evaluate
Display slide 24. Hand out the attached Public Service Announcement Rubric, and instruct students to create public awareness content that is at the level of a child (approximately age 5-10), related to air pollution, and includes any important information that they think the public should know. Inform students that they may choose to put the content in the form of a book, poster, podcast, song, or video to bring awareness to the harmful effects of air pollution.
Encourage students to think about how they might describe the connection between air quality and asthma to a younger sibling or family member. Student PSAs should also explain why our bodies respond to air pollution in this way.
Resources
American Council of Science and Health. (2016, January 27). Here’s why carbon monoxide is so dangerous. [Infographic]. https://www.acsh.org/news/2016/01/27/why-carbon-monoxide-is-so-dangerous
Britannica. (2000). Chemistry of acid deposition. [Image]. https://www.britannica.com/science/acid-rain/Chemistry-of-acid-deposition
Butcher, K. (2018, May 17). Ozone Alert Day issued for Oklahoma City, Tulsa metro areas for Thursday. KFOR.com Oklahoma City. https://kfor.com/news/ozone-alert-day-issued-for-oklahoma-city-tulsa-metro-areas-for-thursday/.
Haggstrom, M. (2015, June 7). Symptoms of lead poisoning (raster). [Image].
https://commons.wikimedia.org/wiki/File:Symptoms_of_lead_poisoning_(raster).png#file
K20 Center. (2020, September). Anchor Charts. Strategies. https://learn.k20center.ou.edu/strategy/58.
K20 Center. (2021, July). Driving Question Board. Strategies. https://learn.k20center.ou.edu/strategy/1511?rev=8567
K20 Center. (2020, September). Gallery Walk / Carousel. Strategies. https://learn.k20center.ou.edu/strategy/118.
K20 Center. (2020, September). Jigsaw. Strategies. https://learn.k20center.ou.edu/strategy/179.
NASA/JPL-Caltech. (2020, October 21). Particulate matter air pollution is associated with numerous adverse health effects. https://climate.nasa.gov/news/3027/getting-to-the-heart-of-the-particulate-matter/
Oklahoma Department of Environmental Quality. (2020). Lead in air. [Fact Sheet]. https://www.deq.ok.gov/documents/?deqattkeyword=&deqdivisons=all&documenttags%5B%5D=fact-sheets
Oklahoma Department of Environmental Quality. (2019). Monitoring charts. https://applications.deq.ok.gov/webdata/aqd/monitoring/charts/OKCAQI2019.htm.
Oklahoma Department of Environmental Quality. (2020). Nitrogen Dioxide. [Fact sheet]. https://www.deq.ok.gov/wp-content/uploads/deqmainresources/NitrogenDioxide_05-2021.pdf
Oklahoma Department of Environmental Quality. (2020, April). Particulate matter. [Fact sheet]. https://www.deq.ok.gov/wp-content/uploads/deqmainresources/ParticulateMatter_04-2020.pdf
Oklahoma Department of Environmental Quality. (2021, January 11). Past air data. https://www.deq.ok.gov/air-quality-division/ambient-monitoring/past-air-data/.
Oklahoma Department of Environmental Quality (2020). Sulphur dioxide. https://www.deq.ok.gov/documents/?deqattkeyword=sulfur&deqdivisons=all&documenttags%5B%5D=fact-sheets
Oklahoma Department of Environmental Quality. (2020, April). Carbon Monoxide [Fact sheet]. Retrieved from https://www.deq.ok.gov/wp-content/uploads/deqmainresources/CarbonMonoxide_04-2020.pdf
Timmeko. (2011, Sept. 2). The nitrogen cycle. [Image]. Flickr. https://flickr.com/photos/timmeko/6106058553/in/photostream/Flickr
United States Environmental Protection Agency. (n.d.). Size Comparisons for PM Particles [Digital image]. https://www.epa.gov/pm-pollution/particulate-matter-pm-basics#PM
United States Environmental Protection Agency. (n.d.) Sulfur dioxide (SO2) pollution. https://www.epa.gov/so2-pollution
.png#file)