
Summary
This activity will introduce the graphs of the sine and cosine functions. Students will discover how to write the equations of transformed sine and cosine graphs.
Essential Question(s)
Why are the trigonometric functions not considered algebraic functions?
Snapshot
Engage
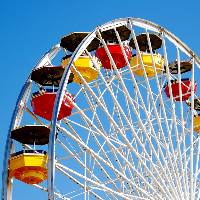
Students determine what the following pictures have in common: a Ferris wheel, a beach, a clock, and weather data. Students then complete a Card Sort for periodic vs. non-periodic functions.
Explore
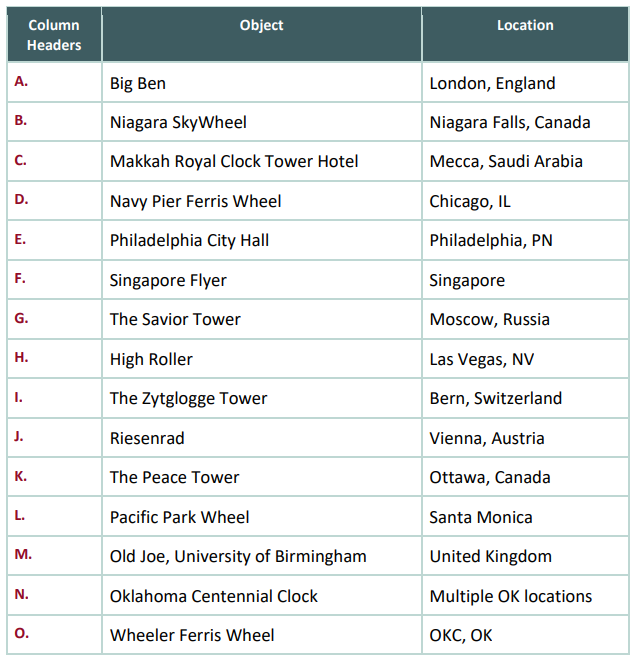
Students look up landmarks including famous clocks and Ferris wheels, weather data, and tide data. They write down facts (mathematical and historical) and construct a height vs. time graph of their data, graphing at least two cycles.
Explain
The teacher provides instruction of the parent graphs of sine and cosine. Students get in groups based on their graphs, create a group graph, and write the equation of their graph, based on their prior knowledge of transformations of functions.
Extend
Students perform a Gallery Walk with their group. If they agree with the equation, they put a check, and if they disagree, they write their predicted equation.
Evaluate
When the groups reach their original posters, they discuss the additions, changes, corrections to their equation and determine which one best fits their graph. Students individually write a Two-Minute Paper over why their group chose the equation they did. When the two minutes is over, they discuss the reason for their choice with their group.
Materials
Graph paper (regular 8.5 x 11, one per student; large, one per group)
Markers
Internet Access (evenings but could be done in class but add in additional time)
Lesson Slides (attached)
Graph Card Sort (attached, one per group)
Data Gathering Sheet (attached)
Group Activity Handout (attached)
Object List (attached)
Teacher Notes for Extensions (attached, optional)
Traditional lesson over the sine and cosine parent functions. Use the one you already have!
Engage
Introduce the lesson using the attached Lesson Slides. Slide 3 displays the lesson’s Essential Question: Why are the trigonometric functions not considered algebraic functions? Slide 4 identifies the lesson’s learning objectives. Review each of these with your class to the extent you feel necessary.
Go to slide 5. The slide displays four images. With their elbow partner, ask them the following question: “What do these pictures have in common?” Give students a couple minutes to come up with a solution and then as a whole group discuss each other's suggestions.
Go to slide 6. Once the students come up with a consensus of what the images may have in common, pass out the Graph Card Sort. Tell students to sort the cards into two categories, but don’t tell them how to categorize. After the groups have categorized their Card Sort, have a whole group conversation about the cards.
Explore
Go to slide 7. Have groups pick a landmark. There are plenty of choices for a landmark so encourage them to not pick the same one as their peers. Once they pick a landmark, pass out the Data Gathering Sheet. On their internet device, have them research about their landmark and answer the following questions on the handout. Tell them not to rush because they will use that data to graph next.
Once they have completed their Data Gathering handout and feel their information is correct, give them a piece of paper, cardstock, or whatever you want them to use to graph. In addition to the paper, pass out the Group Activity Sheet. On the graph paper, have each group do a height vs. time graph of their assigned landmark. The graph should take up the majority of the paper and be appropriately labeled. They need to use the graphing checklist on the Group Activity handout as a guideline. Encourage them to draw a rough draft of the graph before using the final paper.
Explain
Go to slide 8. Give the definition of amplitude, period, and midline. Once you talk about the definitions, have the groups label those on their graphs that they’ve created.
Go to slide 9. Show them different sine and cosine equations and their graphs. Ask if they see any similarities between these and the graphs that they made.
Have students combine their knowledge of sine and cosine functions with their prior knowledge of transformations to come up with an equation that matches their graph. Using function notation and the correct variables, have students write the equation they feel best matches their function.
Extend
Go to slide 10. Instruct students to take a Gallery Walk of the functions they created and determine if the equation written matches the graph. If the equation matches the graph, they should put a check by it. If a group feels the equation is wrong, they should write a new equation on a different sticky note. The next group can determine if either of the equations are correct and place a check by one of them or they can add a new equation.
Evaluate
Go to slide 11. When the groups reach their original posters, they should discuss the additions, changes, corrections to their equation and determine which one best fits their graph. Tell students to individually write a Two-Minute Paper over why their group chose the equation they did. When the two minutes is over, they should discuss the reason for their choice with their group.
Resources
K20 Center. (n.d.). Card sort. Strategies. https://learn.k20center.ou.edu/strategy/147
K20 Center. (n.d.). Gallery walk / carousel. Strategies. https://learn.k20center.ou.edu/strategy/118
K20 Center. (n.d.). Two-minute paper. https://learn.k20center.ou.edu/strategy/152