

Summary
Students will explore the phenomena of light absorption by viewing spectra of sunlight reflected off of different colors of paper. They will match absorption lines created by elements to absorption lines in sun spectra to reveal elements absorbing light in the sun. They will compare the sun's spectrum to the spectrum of another star to generalize what spectra and element absorption can teach about stars.
Essential Question(s)
What is light absorption and how does this phenomenon help scientists identify stars that harbor planets that could support life?
Snapshot
Engage
Students explain the phenomenon that different clothing colors retain heat differently and are introduced to absorption and reflection to explain this. Students also learn about tools used to observe light from the sun and consider physical properties that would allow a star to harbor a planet that could support life.
Explore
By assessing the temperature and recording the spectra of light reflected off of different colors of paper laying in the sun, students explore absorption. Students use a database of element absorption to correlate light absorption from specific elements to absorption lines observed in solar spectra.
Explain
Students explain (a) absorption differences for papers and clothing of varying color, (b) atomic-level mechanics and energetics of absorption, and (c) the extent to which absorption lines allow the elemental composition of stars to be assessed from a distance.
Extend
Students compare the spectra of the sun and Vega to generalize similarities and differences in star spectra. Students can be offered four different research extensions to further explore the search for planets capable of supporting life, practice quantitative calculations with an Algebra I level equation, engineer an improved spectrophotometer, or study biological examples of absorption.
Evaluate
Students can write a "two-minute paper" to reflect on a summary prompt provided by the teacher, provide formative assessment using the Muddiest Point activity to clear up incomplete understanding, and/or participate in the Gallery Walk strategy to share answers to Extend questions.
Materials
Lesson Slides (attached)
Student Activity handout (attached; one per student)
Absorption Lines for Eight Elements Data (attached; one per group)
Representative Data for Teacher Reference (attached)
Sample Responses for Teacher Reference (attached)
Project STAR Spectrometer (available in our kit or can be purchased from several vendors; preferably one per group of 1–3 students)
White paper, matte finish (one piece per group)
Different colors of paper, solid colors and matte finish (at least two different colors per group)
Colored pencils, pens, markers, or crayons for recording observations in color
Student computers (optional)
Wifi
Engage
Use the attached Lesson Slides to guide students through the lesson. Edit, add, or omit slides to suit your needs.
Display slide 2 to introduce the lesson title.
Move to slide 3 and share the essential question with your students: What is light absorption and how does this phenomenon help scientists identify stars that harbor planets that could support life?
Move to slide 4 and share the lesson's learning objectives with your students:
Explore the phenomena of light absorption by viewing the spectrum of the sun reflected off of different colors of paper.
Analyze data to identify elements that absorb light in the sun and learn about the importance of this absorption.
Compare light spectra from two stars to learn more about how spectra are used to categorize stars.
Distribute pages 1-2 of the Student Activity Handout to each student. (It can be advantageous to wait to distribute page 3 because Part A is about acquiring data shown on page 3.) Ask students to spend a few minutes answering the Engage questions individually or with Elbow Partners (perhaps as a bellringer). Then, use slides 5–7 to briefly discuss the Engage questions and prepare students for the Explore phase.
Explore
For Part A of Explore, put students in groups, distribute spectrometers/spectroscopes, and clarify that the goal is to look at light reflected off of different colors of paper to view and document spectra. Remind students to look for the rainbow spectra (introduced in Engage).
Circulate among student groups to make sure they can see and are documenting the rainbow spectra. Ensure each group member gets a turn using the spectrometer. Consider allowing students to use phone cameras to record images of the spectra.
Pass out Part B of Explore (pages 4-5) in the Student Activity Handout.
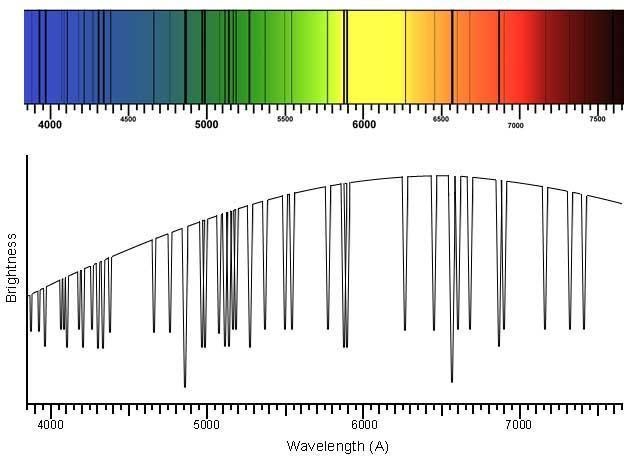
Move to slide 8 to introduce students to the figures used in part B. The spectrum is the sun's just like the spectra they observed in Part A, but shows pronounced absorption lines that students may have struggled to find in Part A. The graph below the spectrum shows the brightness of each color in the sun's spectrum. Dips represent black/missing colors created by absorption.
Display slide 9 and share the goal of part B, which is to show that absorption lines in the sun spectrum match absorption produced by specific elements.
Have students look at the element absorption lines either by using an online database or by distributing the attached Absorption Lines for Eight Elements Data handout. Eight elements are included in the simplified database. Ask students to look for and mark specific element absorption lines on the solar spectrum (see sample data below). Reassure students that some elements do not match the solar spectrum very well and that it is okay if they don't find a match. You might want to work the first element together as a class demonstration to get everyone oriented. Students can do this matching without understanding why element absorption is happening in the stars. Those details will be made clearer during the Explain and Extend phases.
Once oriented, this part of Explore can go quite quickly. Be prepared to have students use extra class time to work on the Explain questions individually or in groups. Explain questions can also be assigned as homework.
Explain
Display slides 11-12 to describe the Bohr diagrams which show energetic and physical changes for electrons in an atom.
Use slide 13 to introduce or reinforce the logic that to absorb light in a star, the element must be in that star.
Assign students the Explain questions in the Student Activity Handout. Decide if you want them to work individually or in small groups. Encourage students to take chances and hypothesize their own ideas first. Then, facilitate some whole-class discussion as a follow up.
Part B Explain questions require Part B of Explore to be completed.
Extend
With Extend questions 1–6, students compare the spectra of two stars to infer general patterns about star spectra. First, ask students to attempt the core expansion of questions 1–6 on their own or with partners (at school or at home). Then, use slide 14 to support follow up class discussion.
Extend questions 7–10 are optional. They can be cut to shorten the lesson or expanded and tailored to extend it for the entire class or a cohort of students. Consider using the "Gallery Walk" strategy to share out student results and evaluate (slide 15).
Evaluate
Slides 15-18 help introduce three options for evaluation.
Two-minute Paper (slide 16) is a strategy we recommend for a culminating summative activity. The suggested prompt on slide 16 should be tailored to address any specific point you want to emphasize.
Resources
Australian Academy of Science. (n.d.). Will looking at the sun really make you blind? Australian Academy of Science. https://www.science.org.au/curious/people-medicine/will-looking-sun-really-make-you-blind
Anderson, Paul Scott. (2020, January 23). Goldilocks stars best for alien life? Earth Sky. https://earthsky.org/space/goldilocks-stars-g-k-dwarfs-best-for-alien-life
K20 Center. (n.d.). Elbow partners. Strategies. https://learn.k20center.ou.edu/strategy/116
K20 Center. (n.d.). Gallery Walk. Strategies. https://learn.k20center.ou.edu/strategy/118
K20 Center. (n.d.). Muddiest Point. Strategies. https://learn.k20center.ou.edu/strategy/109
K20 Center. (n.d.). Two-Minute Paper. Strategies. https://learn.k20center.ou.edu/strategy/152