

Summary
In this lesson, students make connections between severe weather events and human behavior. Students will play through AWARE: Advanced Weather Awareness & Response Education, a digital game-based learning (DGBL) module; explore population growth data; and research the economic sectors and natural resources in a select few states. Using their gameplay experiences, data, and research as evidence, students will construct an explanation for why people might choose to live in places at high risk for severe weather events.
Essential Question(s)
Why might people choose to live in places at high risk for severe weather events?
Snapshot
Engage
Students make observations and ask questions about population growth and severe weather event data sets.
Explore
Students play the first three eras of AWARE. In groups, they collect data about an assigned state’s natural resources and economy.
Explain
As a class, students discuss what they learned about severe weather and weather technology while playing AWARE. After groups share out their state data, the class identifies possible benefits of living in these states.
Extend
Students play the last two eras of AWARE. They determine what natural hazards would have the biggest impact on their assigned state’s natural resources and economy, and how the technology they learned about in AWARE would be used to address those hazards.
Evaluate
Students create poster presentations of their conclusions and construct evidence-based explanations to answer the essential question.
Materials
Lesson Slides (attached)
I Notice, I Wonder handout (attached; one copy per student)
Census Data spreadsheet (attached; one copy per student)
Disaster Data spreadsheet (attached; one copy per student)
AWARE Gameplay Notes (attached; one copy per student)
AWARE Research Notes (attached; one copy per student)
Devices with internet access
Chart paper (for posters)
Markers, colored pencils, etc. (for posters)
Engage
Introduce the lesson using slide 2 from the attached Lesson Slides. Display slide 3 to share the essential question with students. Display slide 4 to review the lesson’s learning objective.
Go to slide 5 and pass out the attached I Notice, I Wonder handout to each student. Also provide each student with the attached Census Data spreadsheet or a printed copy of the data.
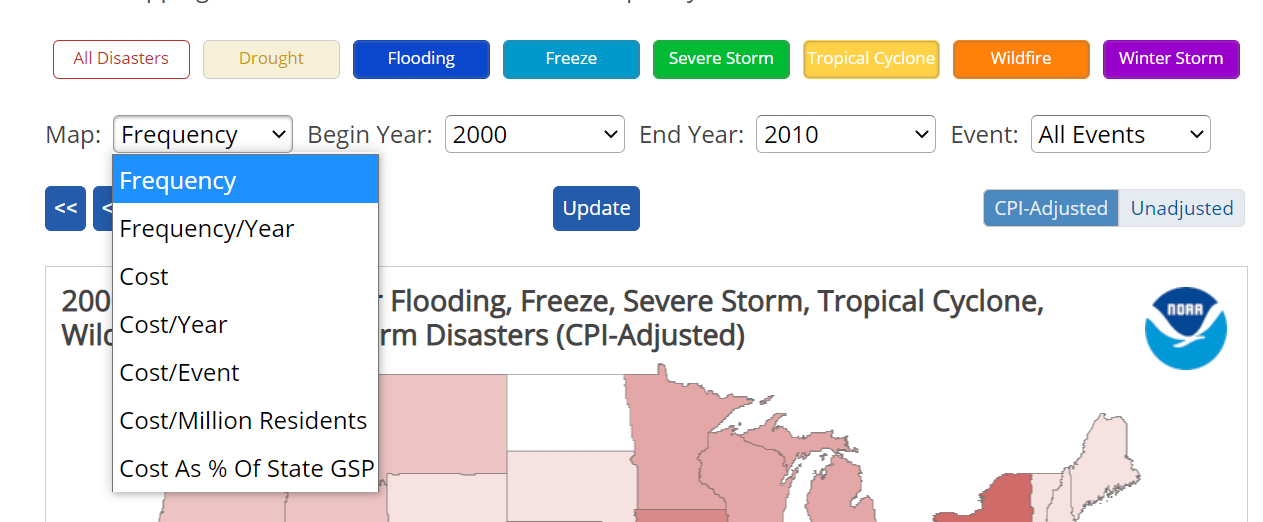
Have students access the following map online: “Billion-Dollar Weather and Climate Disasters.” Students may explore the map data in a variety of ways, but it is recommended that they analyze it in blocks of time (e.g., 5–10 years) to more easily see large-scale changes over time.
Have students use the I Notice, I Wonder strategy to complete the handout as they identify patterns between and within each of the two data sets.
After allowing time for students to fill out the handout, have them share out some of the things they noticed and wondered.
Go to slide 6 and remind students of the essential question. Ask students to share out possible reasons people would choose to live in a place that experiences severe weather events. Use their ideas to develop a class list and record this information in a public, accessible place so students can easily refer to it later.
Go to slide 7. As a class, ask students to categorize the ideas on the class list into three or four themes (e.g., employment opportunities, recreation, etc.) for use in the Explore investigation.
Explore
Display slide 8 and inform students they are going to play Eras 1–3 of AWARE. Plan to give students 25–30 minutes to complete each era.
As they play, ask students to explore the Population and Economic overlays and keep track of any patterns they see on the attached AWARE Gameplay Notes handout. These overlays stay the same for an entire era, so the more eras of the game they complete, the more patterns they can observe. Students should also make a list of the kinds of technology they uncover during their “Research” in the game. Inform students they are going to use this information later in the lesson.
After students have played through Eras 1–3, split students into five groups. Have each group focus on one of the following states with the highest population growth since the 1980 census: Texas, Florida, California, North Carolina, and Georgia.
Go to slide 9. In their groups, have students conduct brief research on their assigned state to identify its natural resources, major industries/economic sectors, and one or more themes from the Engage section that apply to the state. This research does not need to be an in-depth study of these concepts, just a basic overview or summary.
Explain
Display slide 10. As a class, have students discuss their gameplay experiences. Some questions include, but are not limited to:
What patterns did you identify between the population and economic overlays?
What did you notice about how technology changed between eras?
How did the technology affect your ability to forecast, mitigate, and respond to severe weather events?
After discussing, go to slide 11 and have groups share out their findings from their brief research. Record this information in a public, accessible place so students can easily refer to it later. If more than one group investigated each state, have additional groups add any new information that the other group(s) did not already share.
Once each group has shared, have a whole-class discussion about the similarities that students noticed among the different states. As a class, have students summarize the possible benefits of moving to these states.
Go to slide 12 and revisit the essential question and themes list from the Engage section. Based on the class discussion of similarities, ask students whether they have any new ideas to add or changes to make to the list of themes that might explain why people would move to these states.
Extend
Display slide 13. Have students play Eras 4–5 of AWARE, continuing to keep notes on overlay patterns and technology.
After they complete the game, have students connect what they learned during gameplay to the research they conducted in the Explore section.
Go to slide 14 and pass out the attached AWARE Research Notes handout. Ask students to revisit the Billion-Dollar Weather and Climate Disasters map. Using the handout, the map, and the information provided in the “Events” tab, have students record their answers to the following questions about their group’s assigned state:
Which types of severe weather have increased in frequency?
What were the specific impacts of these severe weather events?
Which natural resources, industries, etc. would be most affected by these severe weather events?
Go to slide 15. Have students in each group reference their AWARE Gameplay Notes to determine which technology they learned about is most relevant to their state’s severe weather events.
Additionally, ask students to explain how this technology would be used to forecast, mitigate, and/or respond to the weather threat(s) and their effects. Inform students they are going to create a poster and present this information in the Evaluate activity.
Evaluate
Have groups create posters to present their findings to the class. These posters serve as a final source of evidence to help students answer the essential question.
After students have viewed their classmates’ posters, have students revisit the list of themes they’ve developed throughout the lesson. Then, go to slide 17 to review the essential question with students.
Finally, go to slide 18. Have each student use the Claim, Evidence, Reasoning (CER) strategy to construct an evidence-based explanation for why people choose to live in places at high risk for severe weather events.
Students’ answers should include the reasons why people might choose to live in these places despite the risk (i.e., the themes they’ve developed throughout the lesson) and examples of how people use weather and climate technology to make these places safer. Their cited evidence should come from AWARE, the Billion-Dollar Disasters map data, the census data, their state-specific findings, and/or their classmates’ findings.
Resources
Census Bureau. (2021). Historical population change data (1910-1920). U.S. Department of Commerce. https://www.census.gov/data/tables/time-series/dec/popchange-data-text.html
K20 Center. (n.d.). Claim, evidence, reasoning (CER). Strategies. https://learn.k20center.ou.edu/strategy/156
K20 Center. (n.d.). Fishbone. Strategies. https://learn.k20center.ou.edu/strategy/1664
K20 Center. (n.d.). Gallery walk/Carousel. Strategies. https://learn.k20center.ou.edu/strategy/118
K20 Center. (n.d.). I notice, I wonder. strategies. https://learn.k20center.ou.edu/strategy/180
K20 Center. (n.d.). Mind maps. Strategies. https://learn.k20center.ou.edu/strategy/1277
K20 Center. (n.d.). One-pager. Strategies. https://learn.k20center.ou.edu/strategy/72
National Centers for Environmental Information. (2021). Billion-dollar weather and climate disasters [Interactive map]. U.S. NOAA. https://www.ncdc.noaa.gov/billions/mapping
