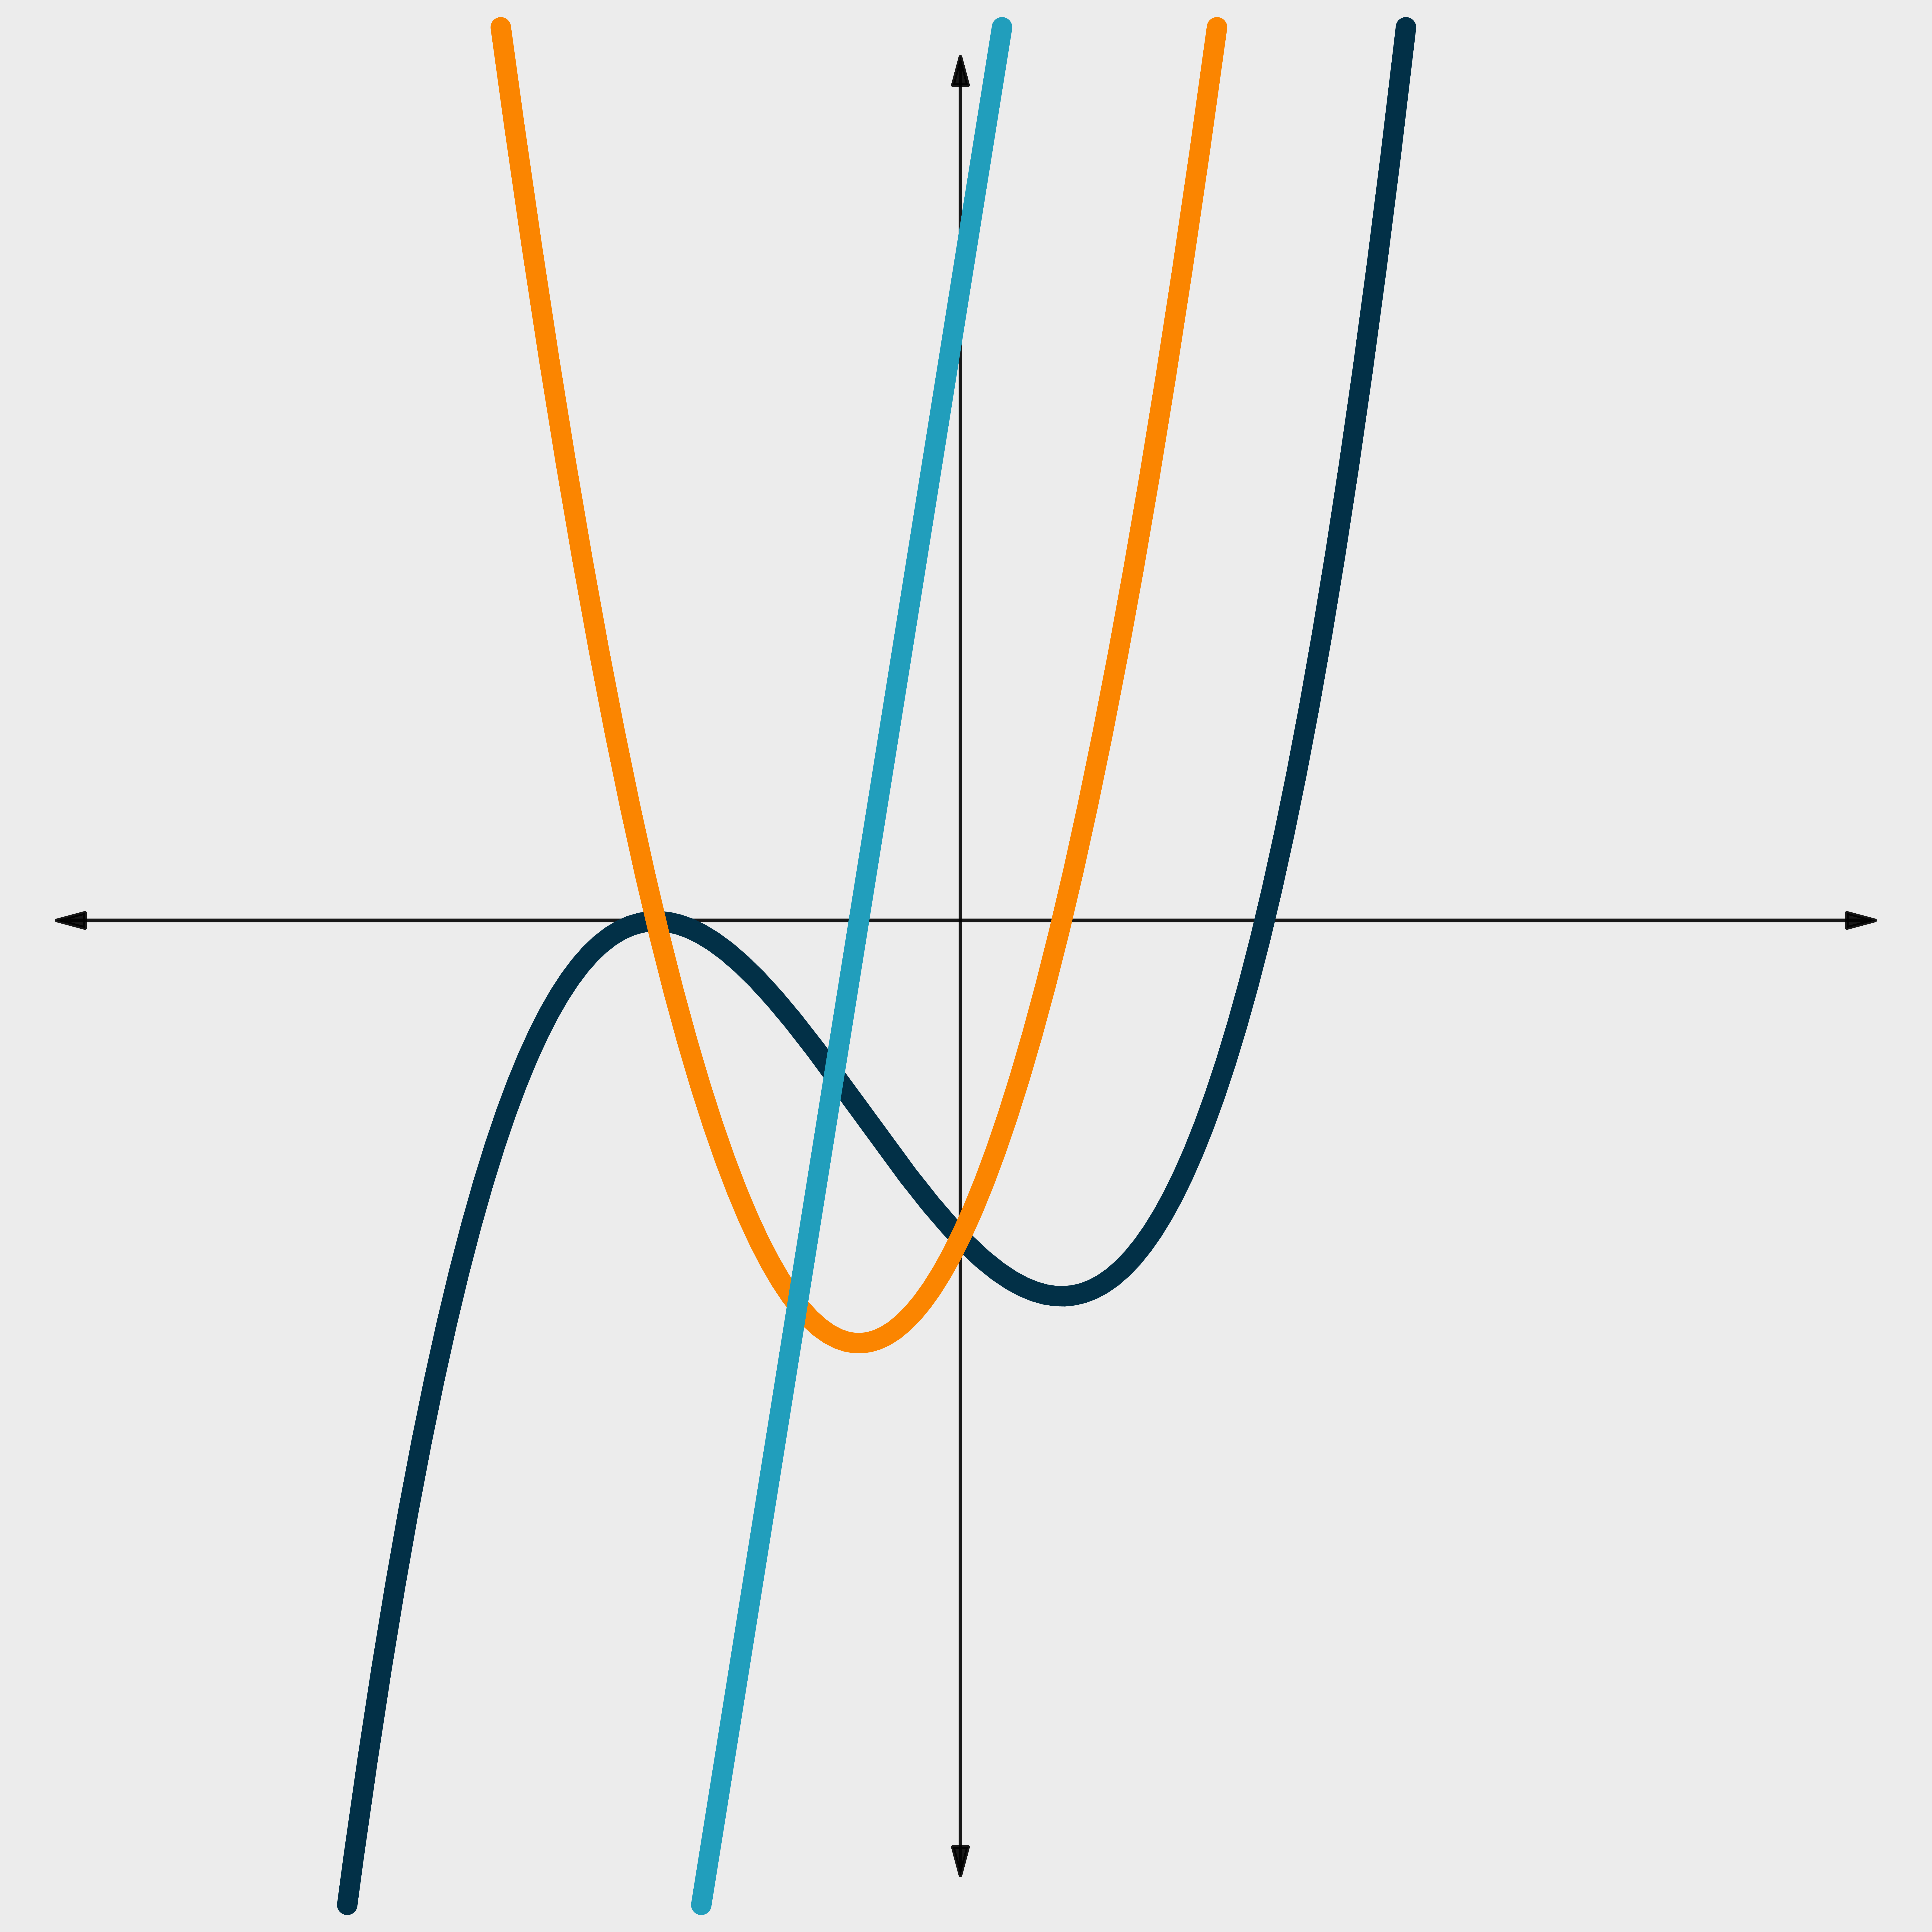
The goal of this lesson is to help students understand the relationships between a function and its first and second derivatives. Students will analyze graphs recalling their knowledge of sketching graphs by hand using the first and second derivatives and apply their graphical knowledge verbally through... Read more »
Connecting Functions and Their Derivatives
Grade Level
Course
Subject
Standards

Students will use a graphing tool to analyze basic transformations on linear, absolute value, and quadratic parent graphs in order to create general rules about function transformations. Read more »
Function Transformations
Course
Subject
Grade Level
Standards

Students will use a graphing calculator to explore function transformations on polynomial (quadratic and cubic), radical (square root and cube root), and transcendental (exponential and logarithmic) functions. Students then generalize these transformations using function notation. Read more »
Function Transformations
Grade Level
Course
Subject
Standards

In this lesson, students will use an investigation to explore rational functions. Students will formalize their understanding of a rational function and continue to investigate the relationship between the equation of a simple rational function and its graph. Read more »
Investigating Graphs of Rational Functions
Grade Level
Course
Subject
Standards

This lesson invites students to explore scientific models and simulations to learn about climate and weather phenomena. Students will learn from a meteorologist about how those in the field of climatology use math and science in their careers, as well as the details of this job and career path. By the... Read more »
ICAP Science: Weather
Related
Grade Level
Subject
Standards

Relationship Between the Unit Circle and the Sine Curve
Grade Level
Students will explore the rotation of a Ferris wheel and make conjectures about the function represented by the motion. Students will find and plot points in the motion and use technology to find the line of best fit. Students will also manipulate the equation for their function to discover what the... Read more »
Relationship Between the Unit Circle and the Sine Curve
Grade Level
Course
Subject
Standards

Students will investigate logistic functions as mathematical models of real-world situations, such as zombie outbreaks, and make comparisons with exponential growth models. Students will learn about the properties of the logistic curves and how to graph logistic functions by hand. This lesson can be... Read more »
Logistic Functions
Grade Level
Course
Subject

In this lesson, students use the Desmos Studio graphing calculator to explore how changing the y-intercept or slope of a line affects the graph. They will find real items to serve as examples of lines with defined slopes and use Desmos Studio to find the linear functions that represent those items.... Read more »
Slope-Intercept Form
Course
Subject
Grade Level
Standards

In this lesson, students will explore the properties of linear and nonlinear relationships by examining tables, graphs, and descriptions. They will then calculate the linear regression model for a set of data and evaluate the reliability of the model by interpreting the correlation coefficient. Read more »
Linear Regression
Course
Subject
Grade Level
Standards

