

Summary
This curated collection of math lessons for grades 6–9 is designed to support teachers in understanding how movement strategies can be authentically integrated into mathematics instruction. Each resource highlights a model lesson that demonstrates purposeful student movement aligned to mathematical goals. Brief annotations accompanying each link point to specific moments within the lesson where movement is used to enhance engagement, reasoning, or collaboration. Together, the collection provides practical examples and inspiration for teachers seeking to incorporate meaningful, standards-aligned movement into their own math classrooms.Resources

This lesson challenges students to write and solve proportions comparing the characteristics of a larger community with the characteristics of a smaller community. Students begin the lesson by listening to a story about what the world would look like and sound like if it were represented by 100 people.... Read more »
Created by: Amber Stokes
Date Updated: December 6th, 2024
If Our Classroom Were the World
Proportions
- Middle School Mathematics
- Mathematics
- 7th Grade
- 7.N.1.2, 7.A.2.3, 7.A.2.4, AF401, A501
In the Engage section, students demonstrate their prior knowledge of world populations in a whole class vote with a Sticky Bars activity then listen to or read the book If the World Were a Village.

In this lesson, students compare methods to evaluate numerical expressions with and without the use of a non-scientific calculator. Students begin by discussing the pros and cons of modern technology. They then explore the limitations of a non-scientific calculator when using one to evaluate numerical... Read more »
Created by: Corrie Matchell
Date Updated: April 28th, 2025
Are You Smarter Than a Calculator?
Order of Operations
- 6th - 7th
- Middle School Mathematics
- Mathematics
- 7.A.4.1, 7.A.4.2, N 201
In the Engage section, students debate and discuss the pros and cons of technology using Fold the Line. While in the Evaluate section, students evaluate an expression then review their peer’s work during a Commit and Toss activity.
This lesson focuses on teaching students how to solve algebraic equations using student-friendly language. Students will begin by trying to solve viral math posts in groups. Next, they will learn the "Do/Undo" method for solving equations. Finally, students will create their own viral math posts and... Read more »
Created by: Mariah Warren
Date Updated: December 13th, 2024
Going Viral
Solving Equations
- Middle School Mathematics
- Mathematics
- 7th Grade
- 7.A.3.1, AF301, AF302, A302
In the Engage section, students use the strategy Not Like the Others to select from four options to determine which image is not like the others and justify their thinking, trying to convince their peers. While in the Evaluate, students walk around and solve other student’s viral posts using the Gallery Walk strategy.

In this lesson, students explore the relationship between a set of numbers and the constraints of an inequality. They will write, graph, and identify solutions to inequalities and connect these to real-world scenarios when applicable. Read more »
Created by: Brittany VanCleave
Date Updated: November 14th, 2025
Pie > Everything, Part 1
One-Step Inequalities
- Middle School Mathematics
- Mathematics
- 7th Grade
- 7.A.3.2, A405, A503
In the Extend, students move around the room matching scenarios with inequalities and finding corresponding algebraic and graphical solutions.

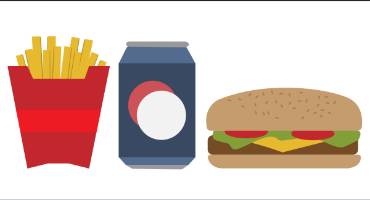
In this lesson, students will relate the distributive property to ordering a combo meal at a fast-food restaurant. Then they will apply this property to simplify algebraic expressions and explain their steps. Read more »
Created by: Brittany VanCleave
Date Updated: November 14th, 2025
Sharing Is Caring
Distributive Property
- Pre-Algebra
- Mathematics
- 8th Grade
- PA.A.3.2, A303
In the Explore, students explore the different ways to algebraically represent their combo meal before they see that they created a real-world distributive property scenario. After creating food trucks and combo meals, students use the Gallery Walk strategy.
In this lesson, students make connections between prior knowledge and new knowledge of mathematical concepts. Students label dot plots and box and whisker plots, identify minimum, maximum, and median data points, and create box and whisker plots. This lesson encourages students to create their own questions... Read more »
Created by: Cacey Wells
Date Updated: May 29th, 2025
Human Box Plot
Box and Whisker Plots
- 6th Grade
- Mathematics
- 6.D.1.1, 6.D.1.2, 6.D.1.3, S301, S303
In the Engage, students line up by birthday to create a human box plot then discuss other ways they could display their data from the dot plot.

In this lesson, students will look for patterns then formalize rules for multiplying and dividing numbers written in scientific notation and use this to analyze and interpret information about the solar system. Being able to express and interpret numbers in scientific notation is prerequisite knowledge... Read more »
Created by: Corrie Matchell
Date Updated: September 10th, 2025
Notation for NASA, Part 2
Operations with Scientific Notation
- Individual Career Academic Plan (ICAP)
- Mathematics, Science
- Earth Science, Physical Science, Pre-Algebra
- 7th - 9th
- 8.ESS1.2 , 8.ESS1.3 , PA.N.1.3, A511, IOD301, IOD302
In the Engage, students rotate in groups to each poster, applying the Fiction in the Facts strategy to spot the fictional statement among scientific facts.

In this lesson, students toss balls of trash, or "trashketballs," into a wastebasket, recording their shooting percentage at various distances from the basket. With distances measured and percentages figured, students create a scatter plot and a line of best fit to make a linear model of the shooting... Read more »
Created by: K20 Center
Date Updated: August 21st, 2025
Trashketball: Part 1
Scatter Plots and Lines of Best Fit
- Algebra 1, Middle School Mathematics
- Mathematics
- 8th - 9th
- PA.A.1.1, PA.A.1.2, A1.F.1.2, A1.D.1.2, AF301
In the Explore, students gather data to test their hypothesis by shooting baskets and recording shooting percentages.

Students gather and analyze data, identifying all possible data that is less than, less than or equal to, equal to, greater than or equal to, or greater than the generated line of best fit. Read more »
Created by: K20 Center
Date Updated: August 21st, 2025
Trashketball: Part 2
Linear Inequalities
- Algebra 1
- Mathematics
- 9th Grade
- A1.A.2.1, A1.D.1.2, AF602, AF702
In the Extend, students design and conduct an experiment that changes one of the control variables. They will gather data to test their hypothesis by shooting baskets and recording shooting percentages.

In this lesson, students explore the relationship between different linear representations: algebraic, numerical, graphical, and verbal. Students will translate between graphs, tables, equations, and written descriptions. Students also learn how to create an equation from a table using the TI-30XS MultiView... Read more »
Created by: Corrie Matchell
Date Updated: November 14th, 2025
Reduce, Reuse, Represent
Multiple Representations of Linear Functions
- Pre-Algebra
- Mathematics
- 7th - 8th
- PA.A.2.1, PA.A.2.2, PA.A.2.3, AF403, AF502, AF503
In the Engage, students will use the strategy Philosophical Chairs to choose between two different job offers that have different pay rates and starting bonuses then justify their reasoning. While in the Extend, students visit stations and practice translating between representations, developing their flexibility.

In this lesson, students use the Desmos Studio graphing calculator to explore how changing the y-intercept or slope of a line affects the graph. They will find real items to serve as examples of lines with defined slopes and use Desmos Studio to find the linear functions that represent those items.... Read more »
Created by: Michell Eike
Date Updated: January 7th, 2026
Slope Matters
Slope-Intercept Form
- Algebra 1, Pre-Algebra
- Mathematics
- 7th - 9th
- PA.A.2.4, A406, A514
In the Engage, students walk around the room making notes and observations of photos that have strong lines with positive or negative slopes during an I Notice, I Wonder learning activity. In the Explain, students use Commit and Toss to generate a "rule" for the relationship between the linear equation and the graph and justify their decision.

Students will physically model the concept of simplifying algebraic expressions as a class then apply this knowledge to written expressions. This is a great lesson for both introducing, as well as remediating, the concept of combining like terms. Read more »
Created by: K20 Center
Date Updated: July 6th, 2026
Keep It Simple
Simplifying Algebraic Expressions
- Middle School Mathematics
- Mathematics
- 7th Grade
- 7.A.4.1, A303, A402
During both the Engage and Explore sections, students recall how to model algebraic expressions; they then use their models of algebraic expressions to add and subtract algebraic expressions by holding cards and grouping by like terms.
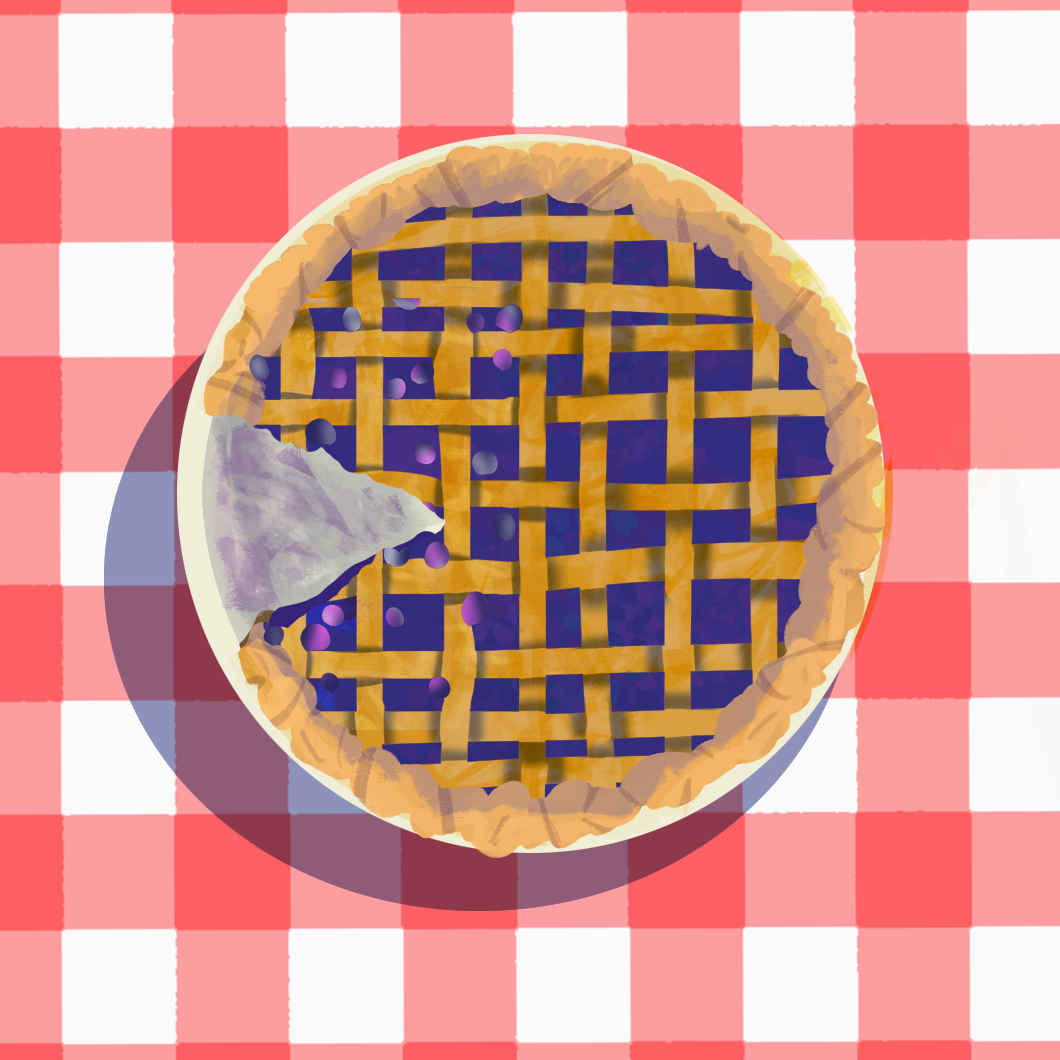
This lesson focuses on the relationship between a set of numbers and the constraints of an inequality. Students write, graph, and identify solutions to inequalities, connecting them back to real-world scenarios when applicable. Read more »
Created by: Corrie Matchell
Date Updated: November 14th, 2025
Pie > Everything, Part 2
Multi-Step Inequalities
- Pre-Algebra
- Mathematics
- 7th - 8th
- PA.A.4.2, A405, A503
In the Extend, students move around the room matching their given scenarios to inequalities and the corresponding algebraic and graphical solutions.
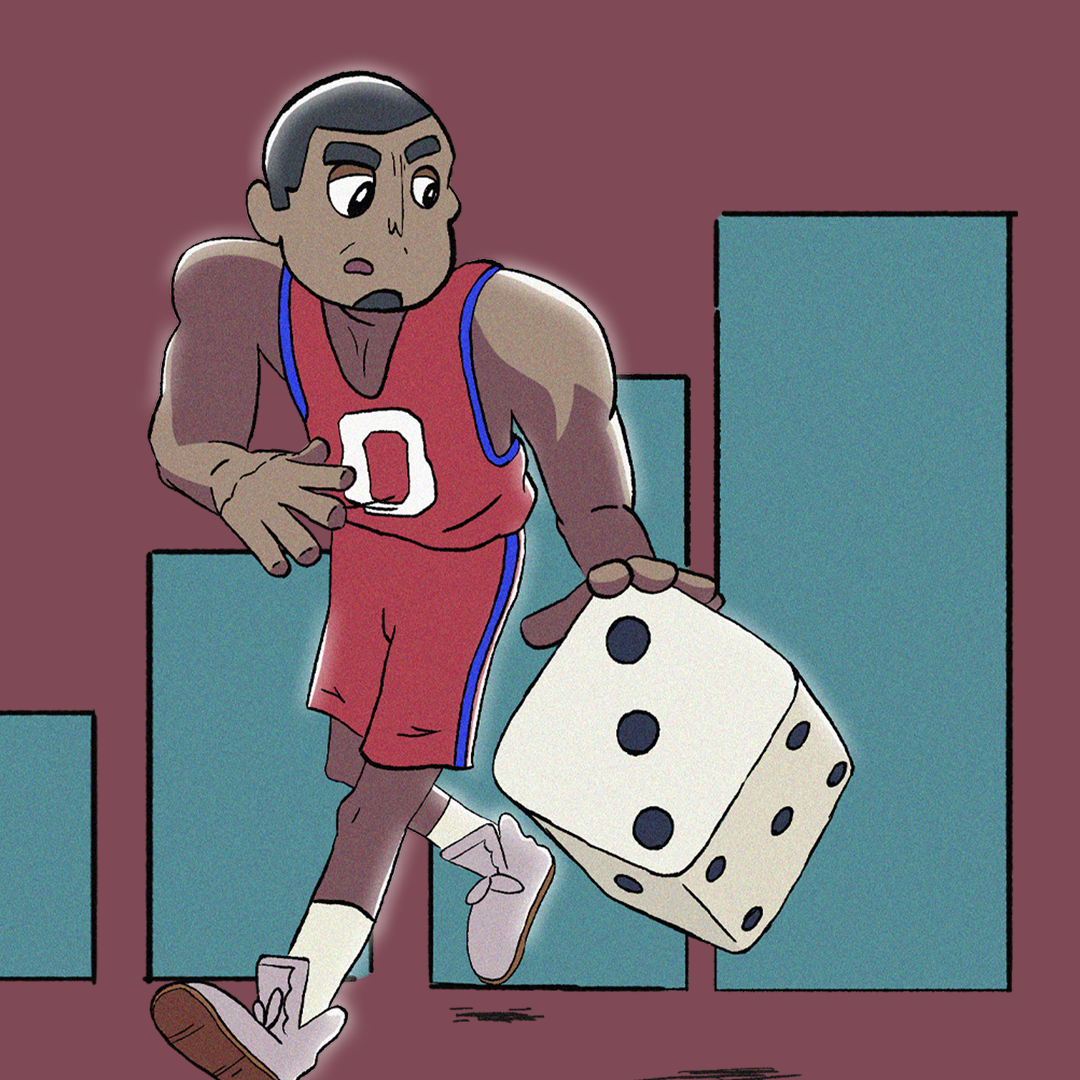
In this lesson, students explore the concepts of statistics and probability in the context of basketball. Students play basketball in the classroom, gather data about shots made and missed, and calculate the probability of a successful shot. Students then step into the role of an NBA statistician and... Read more »
Created by: Amber Stokes
Date Updated: November 14th, 2025
Probability in Sports
Probability
- Individual Career Academic Plan (ICAP)
- Mathematics
- 8th Grade
- PA.D.2.1, N 403, N 503
In the Explore, students shoot baskets using “basketballs” to collect data then determine their own probability of making a successful shot.

This lesson asks students to apply their existing knowledge of this topic by having them apply systems of equations to basketball and basketball statistics. Students also create their own problems. Emphasis is placed on clearly defining variables. Read more »
Created by: Amber Stokes
Date Updated: March 26th, 2026
It's a Numbers Game
Systems of Equations
- Algebra 1
- Mathematics
- 8th - 9th
- A1.A.1.3, A604
In the Evaluate, students participate in a Gallery Walk to solve other students’ story problems. Have students take a notebook and a pencil with them to write down and solve the system of equations for each problem they visit as they travel around the room.

This lesson focuses on solving literal equations by building on the equation-solving knowledge students developed in Parts 1 and 2 of the Journey of the Isolated Variable series. Students will deepen their understanding of rearranging multi-variable equations to isolate a specific variable. By the end... Read more »
Created by: Amber Stokes
Date Updated: March 7th, 2025
Journey of the Isolated Variable, Part 3
Literal Equations
- Algebra 1
- Mathematics
- 9th Grade
- A1.A.3.1, AF502
In the Extend, students participate in a collaborative walk-and-solve exercise where they move around the classroom and find classmates who can solve the problems on their handouts.

This lesson addresses writing linear equations given a table of values. Students will use their knowledge of slope and y-intercept to analyze linear data tables and represent the linear relationship in the data as an equation. Students also will watch a video of a former air traffic controller speaking... Read more »
Created by: K20 Center
Date Updated: November 2nd, 2025
Airplanes and Airstrips, Part 2
Writing Linear Equations: Tables
- Individual Career Academic Plan (ICAP)
- Algebra 1
- Mathematics
- 8th - 9th
- A1.A.4.1, A1.F.3.1, AF503
In the Explain, students use the Expert Stay and Stray strategy to reflect on their peers’ posters and find the similarities and differences and eliminate earlier misconceptions of how to represent a table of values as a linear equation. While during both the Extend and Evaluate sections, students throw paper airplanes to gather data and demonstrate their understanding by writing a linear equation from their peers’ table.

Students will practice data analysis by studying tables and scatterplots. Information regarding the costs of resident and non-resident college tuition and available financial aid. Students will create representations of the data and theorize possible reasons behind the change in education costs over... Read more »
Created by: Corrie Matchell
Date Updated: November 14th, 2025
Plotting Your College Future
Tables and Graphs
- Algebra 1
- Mathematics
- 9th Grade
- A1.F.1.5, A1.D.1.2, AF303
In the Engage, students, working in groups, use the ABC Graffiti strategy to create a list of college majors, which they then share with other groups.
“Junk Food Junction: What’s Your Function?” breaks down the components of a function and the relationship it has in real-world contexts. The goal is to identify different variables of the given function, either by equation or graph. Participants will identify domain, range, independent, and dependent... Read more »
Created by: Brittany VanCleave
Date Updated: November 12th, 2025
Junk Food Junction: What's Your Function?
What is a Function?
- Algebra 1, Pre-Algebra
- Mathematics
- 8th - 9th
- PA.A.1.1, A1.F.1.2, F506
In the Evaluate section, students engage in a Gallery Walk to view other students' advertisements and evaluate the functions for the various vending machines.

In this lesson, students will explore the properties of linear and nonlinear relationships by examining tables, graphs, and descriptions. They will then calculate the linear regression model for a set of data and evaluate the reliability of the model by interpreting the correlation coefficient. Read more »
Created by: Corrie Matchell
Date Updated: November 19th, 2025
Candies and Caddies
Linear Regression
- Algebra 1
- Mathematics
- 8th - 9th
- A1.F.2.1, A1.D.1.3, S506
In the Extend, students complete two experiments (Ball Drop and Candy Drop) and then analyze their data to find the line of best fit and interpret the correlation coefficient.
Standards
This work is licensed under a Creative Commons CC BY-SA 4.0 License.
Report copyright infringement »